
After nearly a decade of sustained high energy prices , U.S. oil and natural gas producers responded to the market’s call for supply with newly exploitable shale resources. The fresh supply helped reduce concerns about global spare production capacity – and limited upward pressure on energy prices. Central bankers around the world were able to maintain highly accommodative monetary policies for prolonged periods as a result.
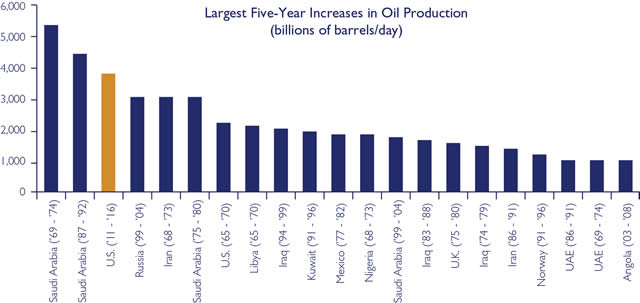
The direct effects of lower energy imports on U.S. employment and investment have, to this point, been muted. Instead, the most important impact of the new supply was to fill a gap created by delays in non-OPEC supply growth as the global economy stabilized following the financial crisis. This unexpected supply played a crucial role in containing energy prices, just as central bankers were busy attempting to spur economic growth. This article will recount how the U.S. started on the path to becoming the largest single source of new production among non-OPEC nations (as estimated by Goldman Sachs and others; see Figure 1) and will assess the economic significance of the new supply.
Rebirth of the U.S. Energy Industry
In commodity markets, the cure for high prices is high prices. Elevated commodity prices over the last decade have indeed provided the economic incentive for a search for more resources. The exploration boom that followed moved along several different lines, from unconventional resources such as shale, to new geographic (e.g., East Africa) and technological frontiers (e.g., in-situ heavy oil or ultra-deep water).
Although the impact has been recent, the roots of the U.S. shale energy boom stretch back three decades to the time when the late George Mitchell first began drilling the Barnett shale near Dallas. Over a number of years, Mitchell Energy had acquired a substantial portfolio of leases around the Dallas area. Mitchell geologists knew that the Barnett shale could be found throughout their acreage, but did not understand how to produce resources from it using conventional techniques. In the early 1990s, Mitchell engineers began testing the idea of hydraulic fracturing using fluids that carried sand into vertical wells.1 The new method helped create and maintain artificial permeability in the rock, allowing the gas to flow to the well bore. But the flow rates from a vertical well were not sufficient to justify the cost of those wells until Mitchell added a horizontal section to the well. That was the right combination. Nearly 20 years after Mitchell Energy drilled its first Barnett shale well, it found the key to unlocking the resources.
Figure 1: U.S. Oil Production Increase Set to Be One of The Largest in History
Devon Energy, also an early mover in the shale revolution, quickly recognized the breakthrough, especially once Mitchell accelerated into production mode. Devon acquired Mitchell in 2002 for $3.5 billion.2 At the time, Devon justified the purchase based primarily on the prospect of Mitchell’s roughly two trillion cubic feet in Barnett gas resources. But Devon understood that if George Mitchell’s original hypothesis had been correct, recovery rates could continue to improve over time and that the two trillion cubic feet of gas in the Barnett Shale might only be the tip of the iceberg. Devon was right. Today the Barnett Shale constitutes about 31% of Texas gas production and is one of the largest-producing fields in the country.3 Three years after the acquisition, Devon announced that it had produced its first trillion cubic feet of gas from the Mitchell assets, and had subsequently booked more reserves than it had at the time of the acquisition.4Devon now produces more than half a trillion cubic feet per year from the Barnett Shale and has an additional 14 trillion cubic feet in net risked Barnett resources.5
Since the original Barnett Shale discovery, the same game plan of tinker, unlock, andexploit has been used in other major basins with shale source rocks, including the Haynesville, the Marcellus, the Eagle Ford, and the Bakken shales (see Figure 2). The key to the success of this plan is the combination of large quantities of resources in place, low recovery rates, and the potential for increase. Often recovery rates in shale basins range from 4 to 10% of resources in place early in the development of a new area. An increase from a very low 4% to a slightly better 8% means that a company can effectively double its reserve potential in an area. This growth in recovery potential was a major driver behind Devon’s success. The proliferation of shale drilling helped drive the development of new drilling and completion techniques, which optimized the cost per well and lowered the price required to justify development.
Initially, the industry focused on gas-rich shale basins. Gas flowed more freely when drilled, as it typically occupied high-pressure reservoirs that were conducive to hydraulic fracturing. At that point, the industry lacked the capability to economically extract oil out of reservoirs that were more technically challenging. The relatively high gas prices of the 2005 to 2008 periods also helped push the early movers towards gas-shale basins. The global financial crisis briefly subdued demand for energy, but the well-funded exploration and production firms drilled through that period, in part due to leasehold requirements. The continued drilling led to a collapse of natural gas prices that persists to this day.
Figure 2: Shale Plays in the Lower 48 States

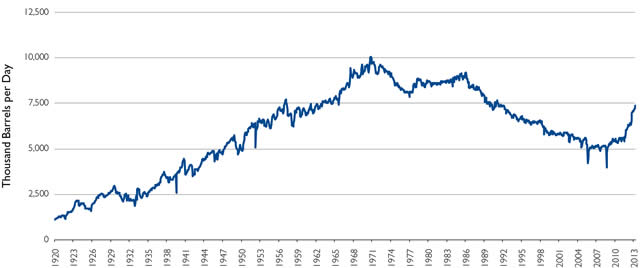
Figure 3: U.S. Field Production of Crude Oil
By the time energy producers depleted capital to allocate towards gas-directed drilling, they had already developed enough internal expertise to focus on the more technically challenging extraction of oil-prone shale resources. By early 2010, companies began shifting more capital towards liquids-prone basins such as the Eagle Ford, Bakken, Niobrara, and the Permian. Resources in these basins included both oil and natural gas liquids, which sold at discounts to oil, but at substantially better prices than dry gas. Even after several years of development of liquid-prone shale resources, prices required to generate satisfactory returns remain substantially higher than those required for gas plays on an energy-equivalent basis, mainly due to the different technical challenges associated with oil extraction. Many oil plays require $8 to $12 per million cubic feet on a gas-equivalent basis to justify development, which is two to four times higher than the best dry gas basins. Fortunately for U.S. energy producers with oil-shale exposure, geopolitical events and production delays in large-scale conventional oil projects have helped keep oil prices high.
The shale revolution led to one of the largest increases of new hydrocarbon production in history. In 2006, U.S. shale gas production represented less than 5% of daily demand. Today, shale gas from dry and associated production accounts for almost 50% of daily demand.6 This shift has occurred despite a decline of more than 75% in the U.S. gas-directed rig count from peak levels in 2008.7 U.S. crude oil production — which had been in steady decline since the mid 1980s — is now in its fifth consecutive year of growth (see Figure 3 above). Current U.S. crude production stands at about 7.5 million barrels per day, up from five million barrels per day in 2009. Industry forecasts of U.S. crude production are still uncertain, but most analysts forecast an additional two to three million barrels per day of crude production growth over the next three to four years.
The Economic Impact of the Growth in U.S. Energy Production
While there has been great enthusiasm over the positive impact on the U.S. economy from a growing U.S. energy supply, the direct effects are in fact fairly limited, due mainly to the large size of the U.S. economy. Barclays’ U.S. economics team estimates that about 200,000 jobs directly related to energy have been created since 2005.8 And Goldman Sachs points out that investment in oil and gas extraction as a percentage of GDP has actually declined since its recent peak in the mid 2000s. It remains well below the prior peak reached in the early 1980s.9
The chemical and refining industries have both benefited from low-cost feedstock, but planned investments are still small, considering the time horizon and magnitude. Because of the low cost of ethane supplies, the U.S. chemical industry has moved from the third to the first quartile on the global ethylene production cost curve. This improvement in the U.S. industry’s cost position has spurred a strong investment phase for a chemical industry that until recently was busy shuttering capacity. Estimates from the American Chemistry Council suggest that by 2020, U.S. ethylene production capacity will have increased nearly 40% over current levels, at an estimated cost of approximately $72 billion.10
The refining industry is showing a much lower appetite for expansion, likely driven by the continued contraction of domestic demand, combined with difficult regulatory and permitting requirements. Several debottlenecking and upgrade projects are underway or have been recently completed, but the size of the total spending is likely to be less than the chemical industry’s.
Very little of the reduction in domestic crude and natural gas prices has been transmitted to consumers. A recent report by Deutsche Bank economists notes that total energy costs constitute about 6% of personal spending as measured by the Personal Consumption Expenditures (PCE) measure, with gasoline purchases making up about 4%, and natural-gas-directed spending about 0.5%.11 Despite the export ban on crude oil, which causes a decoupling of U.S. and global benchmark prices, the U.S. is a net exporter of refined products. This reconnects the U.S. refined-product markets to global markets; U.S. refiners always have the option to export if domestic prices are too low. Export prices are then set by the highest-cost producer in the nearest alternative import market, minus a transportation discount.
The result is that U.S. gasoline buyers typically pay a Brent-linked12 price, which erodes any benefit of a cheap domestic crude supply. While low natural gas prices are reaching the end consumer, the contribution to PCE is too small to be meaningful. Deutsche Bank estimates that the $4 drop in natural gas prices between 2010 and 2012 boosted discretionary spending by only about $30 to $40 billion.11
One of the most widely discussed effects of growth in domestic production is the potential for energy independence and a smaller U.S. trade deficit. Very few believe the productive capacity of U.S. shale oil fields is enough to close the import gap, but it’s possible to narrow it substantially. The remaining gap would have to be closed by reduction in crude demand, which could come via efficiency gains or a shift to alternate sources such as electricity or natural gas. The benefit of a shift towards natural gas (as a transportation fuel) is that it more directly transmits low prices to consumers.
Arguably the most important aspect of the shale-production story is the contribution to non-OPEC supply, which has consistently disappointed analysts and consumers alike over much of the last decade. According to the International Energy Agency (the IEA),13from 2002 until late 2009, non-OPEC producers struggled to increase production meaningfully above 50 million barrels per day, despite historically high prices. Global oil demand surged with an increase of seven million barrels per day during the same period. This increase was absorbed largely by an increase in OPEC supply. The increase in demand ultimately reduced OPEC spare capacity to a level that led to discomfort in global oil markets and to price rationing. As recently as the fall of 2011, Goldman Sachs reiterated its assessment that global demand growth was setting the stage for another spike in oil prices, as OPEC spare capacity again declined.
Enter U.S. shale oil production: from 2009 to the present, North American production has constituted almost all non-OPEC supply growth. The bulk of that supply is derived from shale resources. Since 2011, IEA data show the call on OPEC production has remained roughly flat, while total and spare OPEC capacity has risen. All of the 1.6-million-barrel-per-day increase in demand during the same period has been absorbed by U.S. shale oil production.
Broader implications are difficult to assess. Assuming the prior peak in oil is the right level for demand rationing under a scenario with very low spare capacity, Brent oil prices might have averaged $50 per barrel more than the $100 average since early 2010, based on the 2008 peak. That 50% difference in prices is equivalent to about $1.6 trillion per year (or about 2.0% of annual global output) since early 2010. Over the same period, The Federal Reserve more than tripled the size of its balance sheet, from about $800 billion to about $3 trillion, in its effort to stimulate growth.
U.S. Shale Oil Has Given Central Bankers Much-Needed Latitude
Global economic growth has been stunted by high energy prices for nearly a decade. The persistent upward pressure on energy prices has consistently pushed headline inflation (which includes energy and food prices) well above core inflation, and this has put central bankers on edge. The tepid recovery, combined with relatively subdued energy prices, has allowed central bankers to adopt a more dovish monetary stance for longer than may have been possible had there been more upward pressure on prices.
The unexpected growth in U.S. production filled a gap created by the delay in non-OPEC oil projects, which may have led to another super-spike in crude prices. Over the long term, the production increment from shale oil will likely appear small compared to the capacity in the huge pipeline of world-scale projects scheduled for completion over the next decade.
U.S. shale oil became available at an opportune time, and the absence of price spikes during this period provided central bankers with critical latitude, which in the end may prove to have mattered more to global recovery than the jobs directly attributable to increased production.
http://www.thornburg.com/
The direct effects of lower energy imports on U.S. employment and investment have, to this point, been muted. Instead, the most important impact of the new supply was to fill a gap created by delays in non-OPEC supply growth as the global economy stabilized following the financial crisis. This unexpected supply played a crucial role in containing energy prices, just as central bankers were busy attempting to spur economic growth. This article will recount how the U.S. started on the path to becoming the largest single source of new production among non-OPEC nations (as estimated by Goldman Sachs and others; see Figure 1) and will assess the economic significance of the new supply.
Rebirth of the U.S. Energy Industry
In commodity markets, the cure for high prices is high prices. Elevated commodity prices over the last decade have indeed provided the economic incentive for a search for more resources. The exploration boom that followed moved along several different lines, from unconventional resources such as shale, to new geographic (e.g., East Africa) and technological frontiers (e.g., in-situ heavy oil or ultra-deep water).
Although the impact has been recent, the roots of the U.S. shale energy boom stretch back three decades to the time when the late George Mitchell first began drilling the Barnett shale near Dallas. Over a number of years, Mitchell Energy had acquired a substantial portfolio of leases around the Dallas area. Mitchell geologists knew that the Barnett shale could be found throughout their acreage, but did not understand how to produce resources from it using conventional techniques. In the early 1990s, Mitchell engineers began testing the idea of hydraulic fracturing using fluids that carried sand into vertical wells.1 The new method helped create and maintain artificial permeability in the rock, allowing the gas to flow to the well bore. But the flow rates from a vertical well were not sufficient to justify the cost of those wells until Mitchell added a horizontal section to the well. That was the right combination. Nearly 20 years after Mitchell Energy drilled its first Barnett shale well, it found the key to unlocking the resources.
Figure 1: U.S. Oil Production Increase Set to Be One of The Largest in History
Devon Energy, also an early mover in the shale revolution, quickly recognized the breakthrough, especially once Mitchell accelerated into production mode. Devon acquired Mitchell in 2002 for $3.5 billion.2 At the time, Devon justified the purchase based primarily on the prospect of Mitchell’s roughly two trillion cubic feet in Barnett gas resources. But Devon understood that if George Mitchell’s original hypothesis had been correct, recovery rates could continue to improve over time and that the two trillion cubic feet of gas in the Barnett Shale might only be the tip of the iceberg. Devon was right. Today the Barnett Shale constitutes about 31% of Texas gas production and is one of the largest-producing fields in the country.3 Three years after the acquisition, Devon announced that it had produced its first trillion cubic feet of gas from the Mitchell assets, and had subsequently booked more reserves than it had at the time of the acquisition.4Devon now produces more than half a trillion cubic feet per year from the Barnett Shale and has an additional 14 trillion cubic feet in net risked Barnett resources.5
Since the original Barnett Shale discovery, the same game plan of tinker, unlock, andexploit has been used in other major basins with shale source rocks, including the Haynesville, the Marcellus, the Eagle Ford, and the Bakken shales (see Figure 2). The key to the success of this plan is the combination of large quantities of resources in place, low recovery rates, and the potential for increase. Often recovery rates in shale basins range from 4 to 10% of resources in place early in the development of a new area. An increase from a very low 4% to a slightly better 8% means that a company can effectively double its reserve potential in an area. This growth in recovery potential was a major driver behind Devon’s success. The proliferation of shale drilling helped drive the development of new drilling and completion techniques, which optimized the cost per well and lowered the price required to justify development.
Initially, the industry focused on gas-rich shale basins. Gas flowed more freely when drilled, as it typically occupied high-pressure reservoirs that were conducive to hydraulic fracturing. At that point, the industry lacked the capability to economically extract oil out of reservoirs that were more technically challenging. The relatively high gas prices of the 2005 to 2008 periods also helped push the early movers towards gas-shale basins. The global financial crisis briefly subdued demand for energy, but the well-funded exploration and production firms drilled through that period, in part due to leasehold requirements. The continued drilling led to a collapse of natural gas prices that persists to this day.
Figure 2: Shale Plays in the Lower 48 States
Figure 3: U.S. Field Production of Crude Oil
By the time energy producers depleted capital to allocate towards gas-directed drilling, they had already developed enough internal expertise to focus on the more technically challenging extraction of oil-prone shale resources. By early 2010, companies began shifting more capital towards liquids-prone basins such as the Eagle Ford, Bakken, Niobrara, and the Permian. Resources in these basins included both oil and natural gas liquids, which sold at discounts to oil, but at substantially better prices than dry gas. Even after several years of development of liquid-prone shale resources, prices required to generate satisfactory returns remain substantially higher than those required for gas plays on an energy-equivalent basis, mainly due to the different technical challenges associated with oil extraction. Many oil plays require $8 to $12 per million cubic feet on a gas-equivalent basis to justify development, which is two to four times higher than the best dry gas basins. Fortunately for U.S. energy producers with oil-shale exposure, geopolitical events and production delays in large-scale conventional oil projects have helped keep oil prices high.
The shale revolution led to one of the largest increases of new hydrocarbon production in history. In 2006, U.S. shale gas production represented less than 5% of daily demand. Today, shale gas from dry and associated production accounts for almost 50% of daily demand.6 This shift has occurred despite a decline of more than 75% in the U.S. gas-directed rig count from peak levels in 2008.7 U.S. crude oil production — which had been in steady decline since the mid 1980s — is now in its fifth consecutive year of growth (see Figure 3 above). Current U.S. crude production stands at about 7.5 million barrels per day, up from five million barrels per day in 2009. Industry forecasts of U.S. crude production are still uncertain, but most analysts forecast an additional two to three million barrels per day of crude production growth over the next three to four years.
The Economic Impact of the Growth in U.S. Energy Production
While there has been great enthusiasm over the positive impact on the U.S. economy from a growing U.S. energy supply, the direct effects are in fact fairly limited, due mainly to the large size of the U.S. economy. Barclays’ U.S. economics team estimates that about 200,000 jobs directly related to energy have been created since 2005.8 And Goldman Sachs points out that investment in oil and gas extraction as a percentage of GDP has actually declined since its recent peak in the mid 2000s. It remains well below the prior peak reached in the early 1980s.9
The chemical and refining industries have both benefited from low-cost feedstock, but planned investments are still small, considering the time horizon and magnitude. Because of the low cost of ethane supplies, the U.S. chemical industry has moved from the third to the first quartile on the global ethylene production cost curve. This improvement in the U.S. industry’s cost position has spurred a strong investment phase for a chemical industry that until recently was busy shuttering capacity. Estimates from the American Chemistry Council suggest that by 2020, U.S. ethylene production capacity will have increased nearly 40% over current levels, at an estimated cost of approximately $72 billion.10
The refining industry is showing a much lower appetite for expansion, likely driven by the continued contraction of domestic demand, combined with difficult regulatory and permitting requirements. Several debottlenecking and upgrade projects are underway or have been recently completed, but the size of the total spending is likely to be less than the chemical industry’s.
Very little of the reduction in domestic crude and natural gas prices has been transmitted to consumers. A recent report by Deutsche Bank economists notes that total energy costs constitute about 6% of personal spending as measured by the Personal Consumption Expenditures (PCE) measure, with gasoline purchases making up about 4%, and natural-gas-directed spending about 0.5%.11 Despite the export ban on crude oil, which causes a decoupling of U.S. and global benchmark prices, the U.S. is a net exporter of refined products. This reconnects the U.S. refined-product markets to global markets; U.S. refiners always have the option to export if domestic prices are too low. Export prices are then set by the highest-cost producer in the nearest alternative import market, minus a transportation discount.
The result is that U.S. gasoline buyers typically pay a Brent-linked12 price, which erodes any benefit of a cheap domestic crude supply. While low natural gas prices are reaching the end consumer, the contribution to PCE is too small to be meaningful. Deutsche Bank estimates that the $4 drop in natural gas prices between 2010 and 2012 boosted discretionary spending by only about $30 to $40 billion.11
One of the most widely discussed effects of growth in domestic production is the potential for energy independence and a smaller U.S. trade deficit. Very few believe the productive capacity of U.S. shale oil fields is enough to close the import gap, but it’s possible to narrow it substantially. The remaining gap would have to be closed by reduction in crude demand, which could come via efficiency gains or a shift to alternate sources such as electricity or natural gas. The benefit of a shift towards natural gas (as a transportation fuel) is that it more directly transmits low prices to consumers.
Arguably the most important aspect of the shale-production story is the contribution to non-OPEC supply, which has consistently disappointed analysts and consumers alike over much of the last decade. According to the International Energy Agency (the IEA),13from 2002 until late 2009, non-OPEC producers struggled to increase production meaningfully above 50 million barrels per day, despite historically high prices. Global oil demand surged with an increase of seven million barrels per day during the same period. This increase was absorbed largely by an increase in OPEC supply. The increase in demand ultimately reduced OPEC spare capacity to a level that led to discomfort in global oil markets and to price rationing. As recently as the fall of 2011, Goldman Sachs reiterated its assessment that global demand growth was setting the stage for another spike in oil prices, as OPEC spare capacity again declined.
Enter U.S. shale oil production: from 2009 to the present, North American production has constituted almost all non-OPEC supply growth. The bulk of that supply is derived from shale resources. Since 2011, IEA data show the call on OPEC production has remained roughly flat, while total and spare OPEC capacity has risen. All of the 1.6-million-barrel-per-day increase in demand during the same period has been absorbed by U.S. shale oil production.
Broader implications are difficult to assess. Assuming the prior peak in oil is the right level for demand rationing under a scenario with very low spare capacity, Brent oil prices might have averaged $50 per barrel more than the $100 average since early 2010, based on the 2008 peak. That 50% difference in prices is equivalent to about $1.6 trillion per year (or about 2.0% of annual global output) since early 2010. Over the same period, The Federal Reserve more than tripled the size of its balance sheet, from about $800 billion to about $3 trillion, in its effort to stimulate growth.
U.S. Shale Oil Has Given Central Bankers Much-Needed Latitude
Global economic growth has been stunted by high energy prices for nearly a decade. The persistent upward pressure on energy prices has consistently pushed headline inflation (which includes energy and food prices) well above core inflation, and this has put central bankers on edge. The tepid recovery, combined with relatively subdued energy prices, has allowed central bankers to adopt a more dovish monetary stance for longer than may have been possible had there been more upward pressure on prices.
The unexpected growth in U.S. production filled a gap created by the delay in non-OPEC oil projects, which may have led to another super-spike in crude prices. Over the long term, the production increment from shale oil will likely appear small compared to the capacity in the huge pipeline of world-scale projects scheduled for completion over the next decade.
U.S. shale oil became available at an opportune time, and the absence of price spikes during this period provided central bankers with critical latitude, which in the end may prove to have mattered more to global recovery than the jobs directly attributable to increased production.
http://www.thornburg.com/