

To the members of the FOMC,
You’ve emphasized the tremendous burden placed on the Fed in recent years, and your dedication to collectively doing right by the country. It’s important to start with that recognition, because as concerned as I’ve been about the impact and economic assumptions behind the Fed’s actions, I don’t question your motives or integrity. What follows is simply information that may be helpful in realistically assessing the outcomes and risks of the present policy course, and perhaps to help prevent a bad situation from becoming worse.
Some brief background
As the head of an investment company, it’s natural to conclude that what follows is simply “talking my book,” but for what it’s worth, the majority of my income is directed to the Hussman Foundation. Academically, I earned my doctorate in economics from Stanford, studying with Tom Sargent, John Taylor, Ron McKinnon, Robert Hall, and Joe Stiglitz, and spent several years as a professor at the University of Michigan and Michigan Business School before focusing on finance.
We’ve done well in prior complete market cycles (combining both bull and bear markets), and were among the few who warned of the market collapses and recessions of 2000-2002 and 2007-2009. In contrast, the half-cycle of the past 5 years has been challenging because of the awkward transition it provoked, following a credit crisis that we fully anticipated. Economic policy failures, departures from Section 13(3) of the Federal Reserve Act (which Congress subsequently spelled out like a children’s book), avoidance of needed debt-restructuring (except in the auto industry), and extortionate cries of “global meltdown” from the financial industry all contributed to a collapse in economic confidence beyond anything witnessed in post-war data. That forced us to stress-test every aspect of our approach against Depression-era outcomes. We missed returns from the market’s low in the interim of that stress-testing, and have foregone the more recent speculative advance because identical features have resulted in spectacular market losses throughout history.
In hindsight, the crisis ended - precisely - on March 16, 2009, when the Financial Accounting Standards Board abandoned FAS 157 “mark-to-market” accounting, in response to Congressional pressure from the House Committee on Financial Services on March 12, 2009. That change immediately removed the threat of widespread insolvency by making insolvency opaque. My impression is that much of the market’s confidence and oversensitivity to quantitative easing stems from misattribution of the initial recovery to QE. This has created a nearly self-fulfilling superstition that links the level of stock prices directly to the size of the Fed's balance sheet, despite the absence of any reliable or historically demonstrable transmission mechanism that relates the two with any precision at all.
The FOMC certainly had a part in creating a low-interest rate environment that provoked a reach-for-yield and a gush of demand for securities backed by mortgage lending of increasingly poor credit quality (I’ll note in passing that new issuance of “covenant lite” debt has now eclipsed the pre-crisis peak largely due to the same yield-seeking). Still, it may ease the burden of power to consider the likelihood that the actions of the Federal Reserve – though clearly supportive of the mortgage market – were not responsible for the recovery. One can thank the FASB for that, provided we’re all comfortable with the reduced transparency that results from mark-to-model and mark-to-unicorn accounting.
Recognizing the equity bubble
How does one establish the value of a long-lived asset? Hopefully, that question stirs the economist in all of you, and you immediately respond that every security is a claim on some long-term stream of cash payments (including any terminal value) that the holder can expect to receive over time. If price is known, the discount rate that equates price to the present value of expected future payments can be interpreted to be the expected long-term return of that security. This is how one calculates the yield-to-maturity on a long-term bond, for example. Conversely, we can make assumptions about the long-term return that investors will require over time and then calculate an implied price. Discounting the expected long-term stream of cash flows using some required long-term return results in a “fair value” that quietly incorporates those underlying assumptions.
Of course, nobody likes to discount an entire stream of expected payments, so investors create shortcuts. The most common shortcut is to compress all of the relevant cash flows and discount rates into a “sufficient statistic.” So for example, if we have a perpetuity with price $P that throws off cash flow $C every year forever, the ratio C/P is a sufficient statistic for the expected long-term rate of return, and everything knowable about valuation can be neatly summarized by that ratio. Nice economic assumptions about constant growth rates, returns on invested capital, payout ratios, and other factors encourage similar approaches in the equity market. So we look at price/earnings ratios based on a single year of earnings and immediately believe we know something about long-term value.
But valuation shortcuts are only useful if the “fundamental” being used is representative of the entire long-term stream of cash flows that will be delivered into the hands of investors. And it’s precisely here where the FOMC may find a careful review of the evidence to be useful.
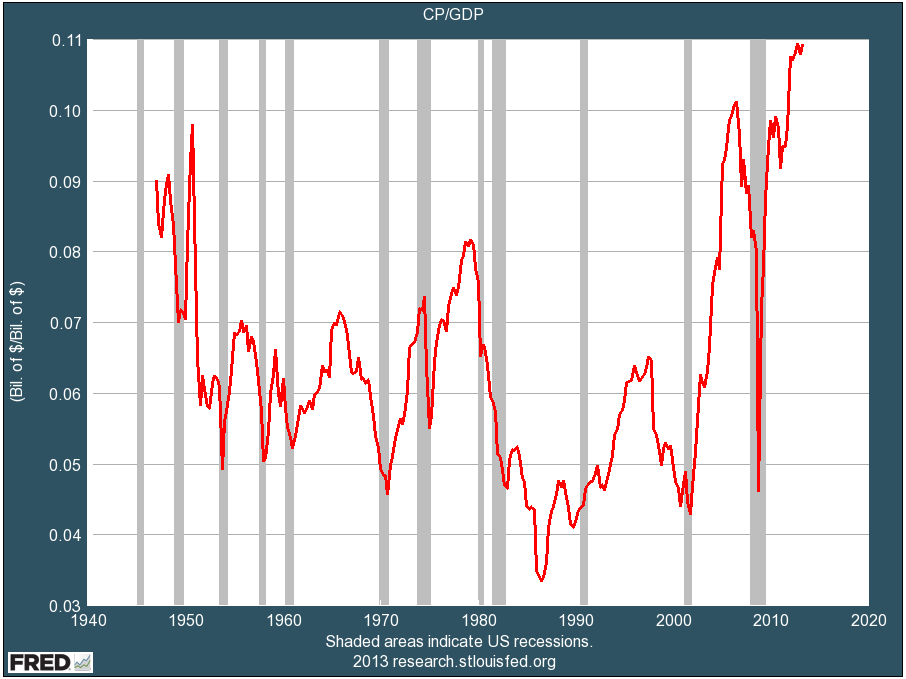
The chart below is from one of the best tools that the Fed offers the public, the Federal Reserve Economic Database (FRED). The chart shows the ratio of corporate profits to GDP, which is presently at a record. The fact that profits as a share of GDP are more than 70% above their historical norm should immediately raise a question as to whether current year earnings or next year’s projected “forward earnings” should be used as a sufficient statistic for long-term cash flows and equity market valuation without any further reflection. Then again, more work is required to demonstrate that such an approach would be misleading. We’re just getting warmed up.
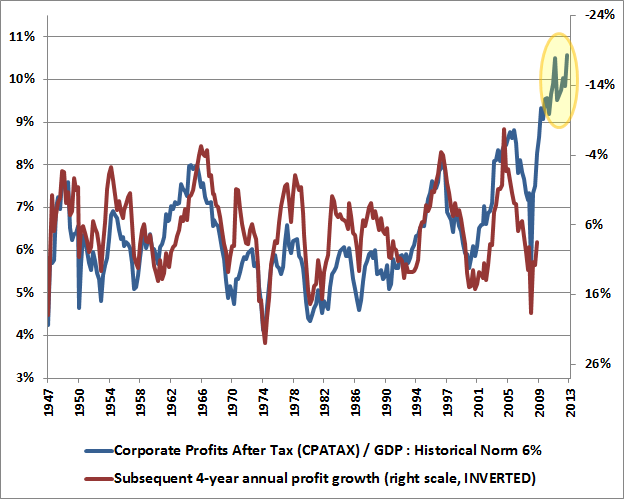
A simple way to see the implications of the present elevation of the profit share is to relate the level of profit margins to subsequent growth in profits over a reasonably “cyclical” horizon of several years. Remember, when one values equities, one is valuing a long-term stream, not just next year’s earnings. Investors taking current-year or forward-year profits as a sufficient statistic should be aware that high margins are reliably associated with weak profit growth over subsequent years.
The next relevant question is to ask why profit margins are presently so high. One might argue that the profitability of companies has achieved a permanently high plateau. Despite historical mean-reversion in profit margins (which tend to collapse over the full course of the business cycle), maybe this time is different. As it happens, we can relate the surfeit of corporate profits in recent years rather precisely to the extraordinary combined deficits of the household and government sectors during the same period.
Read the complete letter
You’ve emphasized the tremendous burden placed on the Fed in recent years, and your dedication to collectively doing right by the country. It’s important to start with that recognition, because as concerned as I’ve been about the impact and economic assumptions behind the Fed’s actions, I don’t question your motives or integrity. What follows is simply information that may be helpful in realistically assessing the outcomes and risks of the present policy course, and perhaps to help prevent a bad situation from becoming worse.
Some brief background
As the head of an investment company, it’s natural to conclude that what follows is simply “talking my book,” but for what it’s worth, the majority of my income is directed to the Hussman Foundation. Academically, I earned my doctorate in economics from Stanford, studying with Tom Sargent, John Taylor, Ron McKinnon, Robert Hall, and Joe Stiglitz, and spent several years as a professor at the University of Michigan and Michigan Business School before focusing on finance.
We’ve done well in prior complete market cycles (combining both bull and bear markets), and were among the few who warned of the market collapses and recessions of 2000-2002 and 2007-2009. In contrast, the half-cycle of the past 5 years has been challenging because of the awkward transition it provoked, following a credit crisis that we fully anticipated. Economic policy failures, departures from Section 13(3) of the Federal Reserve Act (which Congress subsequently spelled out like a children’s book), avoidance of needed debt-restructuring (except in the auto industry), and extortionate cries of “global meltdown” from the financial industry all contributed to a collapse in economic confidence beyond anything witnessed in post-war data. That forced us to stress-test every aspect of our approach against Depression-era outcomes. We missed returns from the market’s low in the interim of that stress-testing, and have foregone the more recent speculative advance because identical features have resulted in spectacular market losses throughout history.
In hindsight, the crisis ended - precisely - on March 16, 2009, when the Financial Accounting Standards Board abandoned FAS 157 “mark-to-market” accounting, in response to Congressional pressure from the House Committee on Financial Services on March 12, 2009. That change immediately removed the threat of widespread insolvency by making insolvency opaque. My impression is that much of the market’s confidence and oversensitivity to quantitative easing stems from misattribution of the initial recovery to QE. This has created a nearly self-fulfilling superstition that links the level of stock prices directly to the size of the Fed's balance sheet, despite the absence of any reliable or historically demonstrable transmission mechanism that relates the two with any precision at all.
The FOMC certainly had a part in creating a low-interest rate environment that provoked a reach-for-yield and a gush of demand for securities backed by mortgage lending of increasingly poor credit quality (I’ll note in passing that new issuance of “covenant lite” debt has now eclipsed the pre-crisis peak largely due to the same yield-seeking). Still, it may ease the burden of power to consider the likelihood that the actions of the Federal Reserve – though clearly supportive of the mortgage market – were not responsible for the recovery. One can thank the FASB for that, provided we’re all comfortable with the reduced transparency that results from mark-to-model and mark-to-unicorn accounting.
Recognizing the equity bubble
How does one establish the value of a long-lived asset? Hopefully, that question stirs the economist in all of you, and you immediately respond that every security is a claim on some long-term stream of cash payments (including any terminal value) that the holder can expect to receive over time. If price is known, the discount rate that equates price to the present value of expected future payments can be interpreted to be the expected long-term return of that security. This is how one calculates the yield-to-maturity on a long-term bond, for example. Conversely, we can make assumptions about the long-term return that investors will require over time and then calculate an implied price. Discounting the expected long-term stream of cash flows using some required long-term return results in a “fair value” that quietly incorporates those underlying assumptions.
Of course, nobody likes to discount an entire stream of expected payments, so investors create shortcuts. The most common shortcut is to compress all of the relevant cash flows and discount rates into a “sufficient statistic.” So for example, if we have a perpetuity with price $P that throws off cash flow $C every year forever, the ratio C/P is a sufficient statistic for the expected long-term rate of return, and everything knowable about valuation can be neatly summarized by that ratio. Nice economic assumptions about constant growth rates, returns on invested capital, payout ratios, and other factors encourage similar approaches in the equity market. So we look at price/earnings ratios based on a single year of earnings and immediately believe we know something about long-term value.
But valuation shortcuts are only useful if the “fundamental” being used is representative of the entire long-term stream of cash flows that will be delivered into the hands of investors. And it’s precisely here where the FOMC may find a careful review of the evidence to be useful.
The chart below is from one of the best tools that the Fed offers the public, the Federal Reserve Economic Database (FRED). The chart shows the ratio of corporate profits to GDP, which is presently at a record. The fact that profits as a share of GDP are more than 70% above their historical norm should immediately raise a question as to whether current year earnings or next year’s projected “forward earnings” should be used as a sufficient statistic for long-term cash flows and equity market valuation without any further reflection. Then again, more work is required to demonstrate that such an approach would be misleading. We’re just getting warmed up.
A simple way to see the implications of the present elevation of the profit share is to relate the level of profit margins to subsequent growth in profits over a reasonably “cyclical” horizon of several years. Remember, when one values equities, one is valuing a long-term stream, not just next year’s earnings. Investors taking current-year or forward-year profits as a sufficient statistic should be aware that high margins are reliably associated with weak profit growth over subsequent years.
The next relevant question is to ask why profit margins are presently so high. One might argue that the profitability of companies has achieved a permanently high plateau. Despite historical mean-reversion in profit margins (which tend to collapse over the full course of the business cycle), maybe this time is different. As it happens, we can relate the surfeit of corporate profits in recent years rather precisely to the extraordinary combined deficits of the household and government sectors during the same period.
Read the complete letter