

Quest Diagnostics Inc (DGX, Financial) has recently shown a daily gain of 3.9%, and a positive performance over the last three months with an 8.67% gain. With an Earnings Per Share (EPS) of 7.43, investors are keen to understand if the stock is currently fairly valued. This article delves into the valuation analysis of Quest Diagnostics (DGX), providing insights into whether the stock's market price aligns with its intrinsic value.
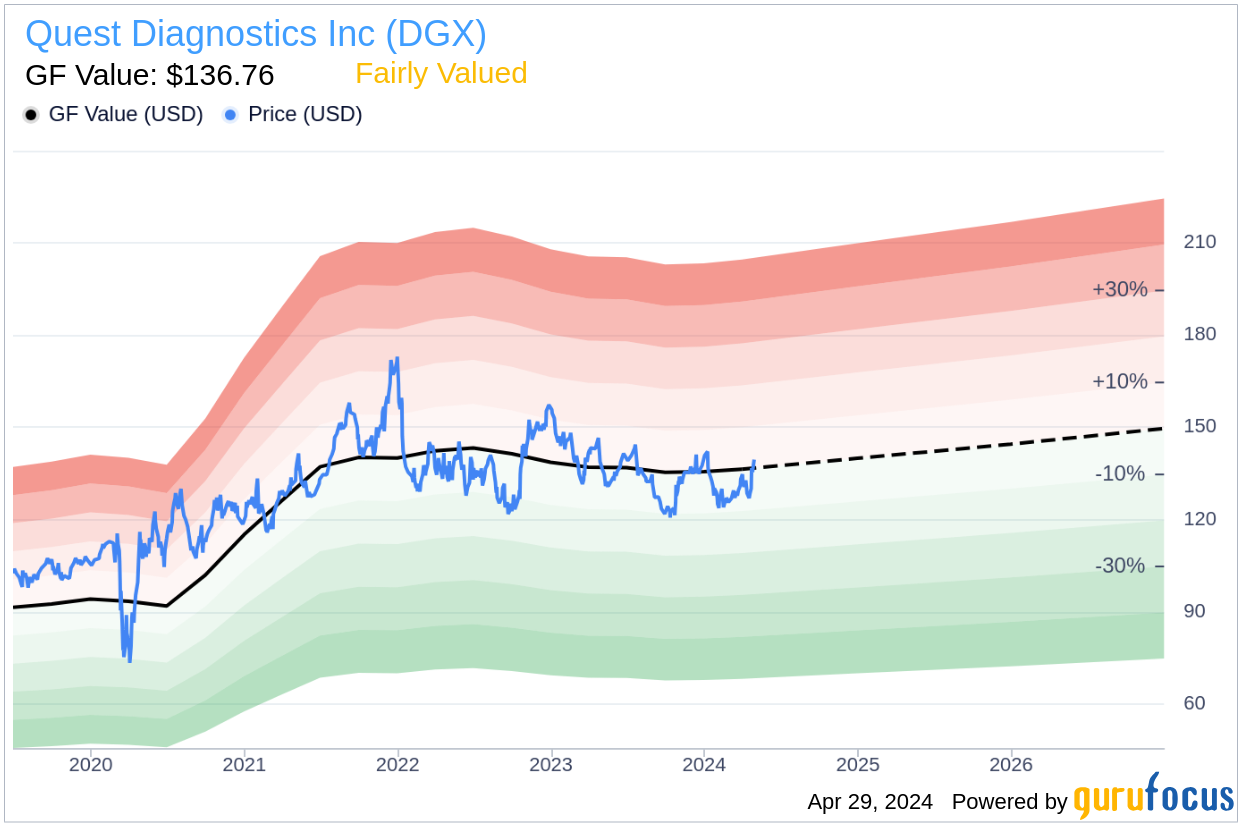
As we explore Quest Diagnostics Inc (DGX, Financial), a leading provider of diagnostic testing services, we notice that its current stock price of $139.5 is hovering around the Fair Value (GF Value) of $136.76. This close proximity suggests that the stock may be trading at a fair value. To fully grasp the significance of this valuation, it's essential to consider the company's comprehensive financial landscape and future prospects.

Understanding the GF Value of Quest Diagnostics (DGX, Financial)
The GF Value is a unique metric that estimates the intrinsic value of a stock using a combination of historical trading multiples, a GuruFocus adjustment factor, and future business performance projections. This value serves as a benchmark for determining whether a stock is overvalued, undervalued, or fairly valued. According to the GF Value, Quest Diagnostics (DGX) is currently fairly valued, indicating that the stock's price is in line with its estimated intrinsic value.
Given that Quest Diagnostics is fairly valued, investors can expect that the long-term return of its stock will likely mirror the company's business growth rate. This assumption is crucial for those considering a long-term investment in Quest Diagnostics.
Link: These companies may deliver higher future returns at reduced risk.
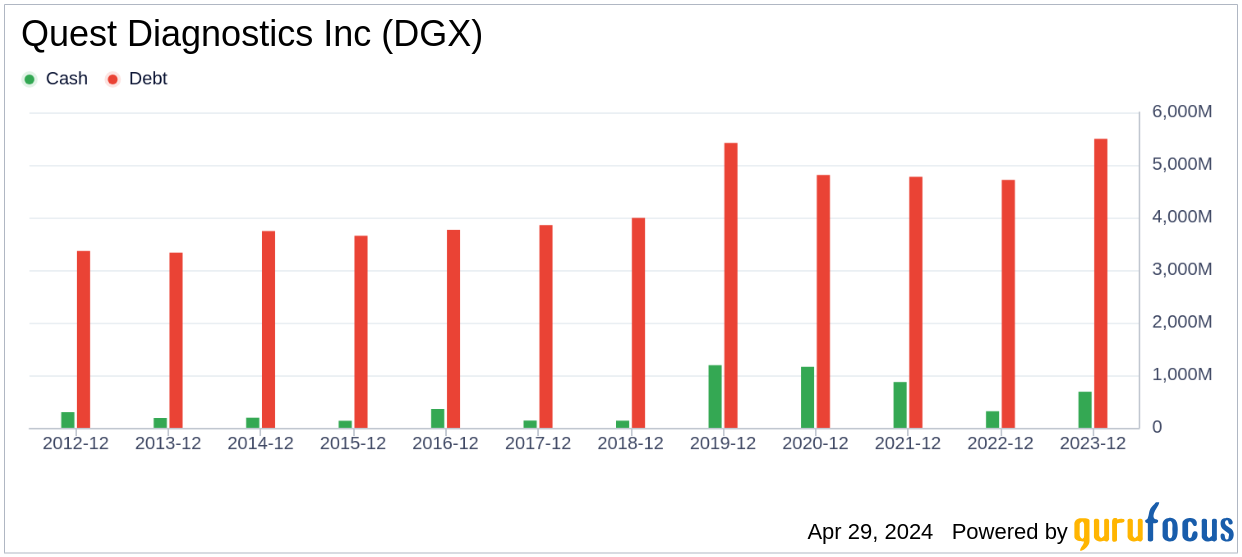
Financial Strength of Quest Diagnostics
Investing in companies with robust financial strength minimizes the risk of permanent capital loss. Quest Diagnostics' financial strength is pivotal to its valuation. With a cash-to-debt ratio of 0.09, Quest Diagnostics ranks lower than many of its industry peers, indicating a need for careful consideration of its debt levels. The company's financial strength is rated as fair by GuruFocus, scoring 6 out of 10.
Profitability and Growth of Quest Diagnostics
The profitability of a company is a critical factor for investors. Quest Diagnostics has maintained profitability over the past decade, boasting an operating margin that outperforms a majority of its competitors. This consistent profitability is a positive indicator for potential investors.
Growth is another cornerstone of valuation. Although Quest Diagnostics' growth rates may not outshine the entire industry, understanding its position within the Medical Diagnostics & Research sector is essential for evaluating its potential for value creation.
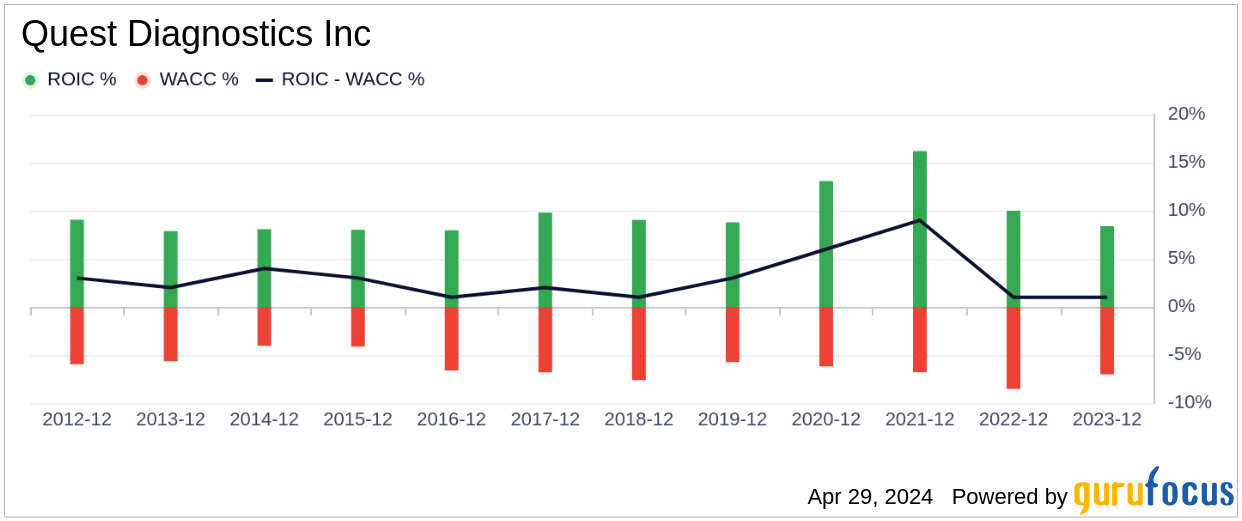
ROIC vs. WACC for Quest Diagnostics
Comparing a company's Return on Invested Capital (ROIC) with its Weighted Average Cost of Capital (WACC) provides insight into its profitability relative to the capital invested. Quest Diagnostics' ROIC surpasses its WACC, suggesting the company is generating value for its shareholders. This comparison is a vital component of the company's financial analysis.
Conclusion
In conclusion, Quest Diagnostics (DGX, Financial) appears to be fairly valued, with a solid financial condition and strong profitability. However, its growth ranks below many of its peers within the industry. For a more detailed exploration of Quest Diagnostics' financials, investors are encouraged to review its 30-Year Financials here.
To discover high-quality companies that may deliver above-average returns, consider exploring the GuruFocus High Quality Low Capex Screener.
This article, generated by GuruFocus, is designed to provide general insights and is not tailored financial advice. Our commentary is rooted in historical data and analyst projections, utilizing an impartial methodology, and is not intended to serve as specific investment guidance. It does not formulate a recommendation to purchase or divest any stock and does not consider individual investment objectives or financial circumstances. Our objective is to deliver long-term, fundamental data-driven analysis. Be aware that our analysis might not incorporate the most recent, price-sensitive company announcements or qualitative information. GuruFocus holds no position in the stocks mentioned herein.