
1 The Company
San Gold Corporation (SGRCF, Financial) is engaged in the exploration, development, and production of gold properties in Canada.
| Number of shares | 373,390,981 |
| Number of options | 20,366,668 |
| Number of warrants | 16,800,000 |
| Fully diluted number of shares | 410,557,649 |
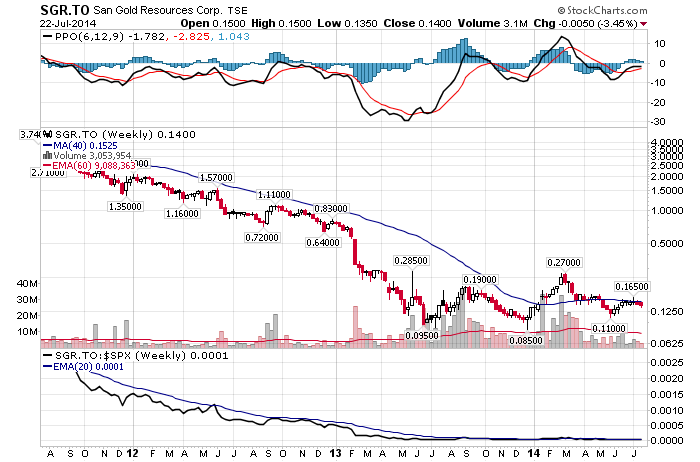
| Share price | $0.13 |
| Market cap | $48.5 million |
| Enterprise value | $92.8 million |
| P/S | 0.54 |
| P/B | 0.39 |
| Ticker | SGRCF,TSX:SGR |
1.1 History
San Gold Corporation was formed in 2005 by the amalgamation of San Gold Resources Corporation of Bissett and Gold City Industries of Vancouver, B.C. Since 2005, San Gold has produced over 350,000 ounces of gold from the Rice Lake mining complex.
1.2 Business Model
The primary product produced by the company is gold. Since commencing commercial production of gold, San Gold has received revenue from the North American gold bullion markets.
1.3 The Mines
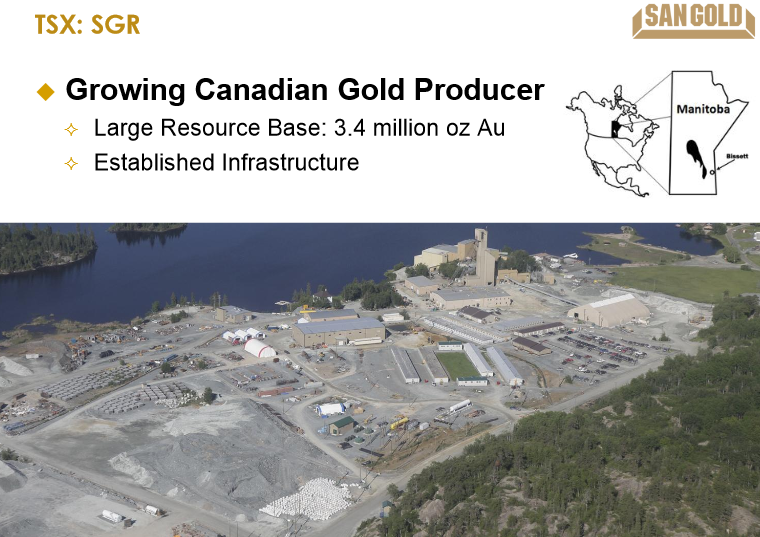
San Gold's Rice Lake mining complex is located 250 km northeast of Winnipeg, Manitoba adjacent to the town of Bissett.
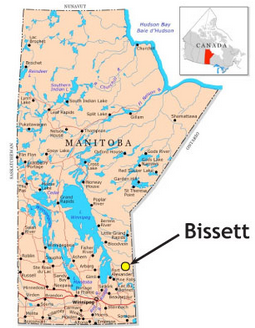
(Source: San Gold)
The company produces gold from the Rice Lake mine, the Hinge mine and the 007 mine each of which forms part of the Rice Lake mining complex.
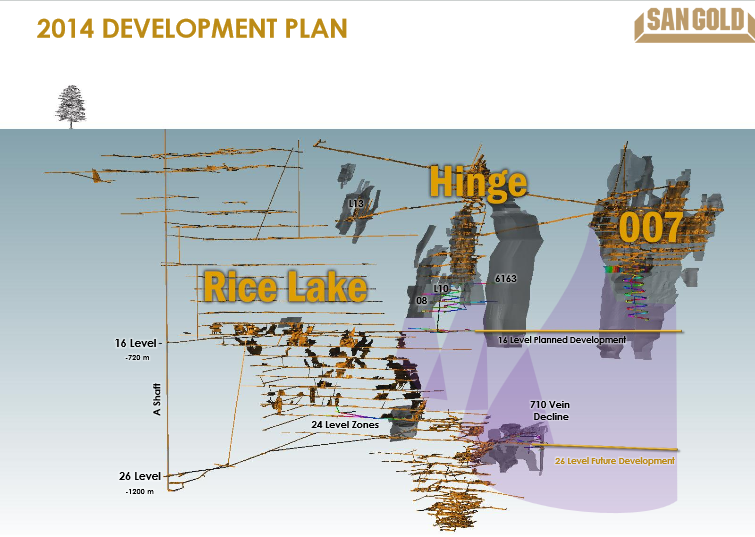
(Source: Investor presentation)
The Rice Lake mining complex has produced 75,000 to 85,000 gold ounces annually during the past three years.
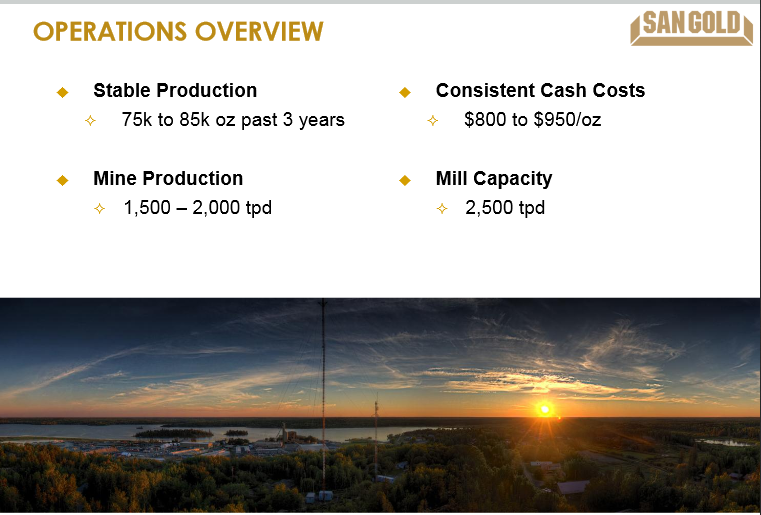
(Source: Investor presentation)
San Gold’s global gold resources are 3.4 million ounces with a relatively high grade.
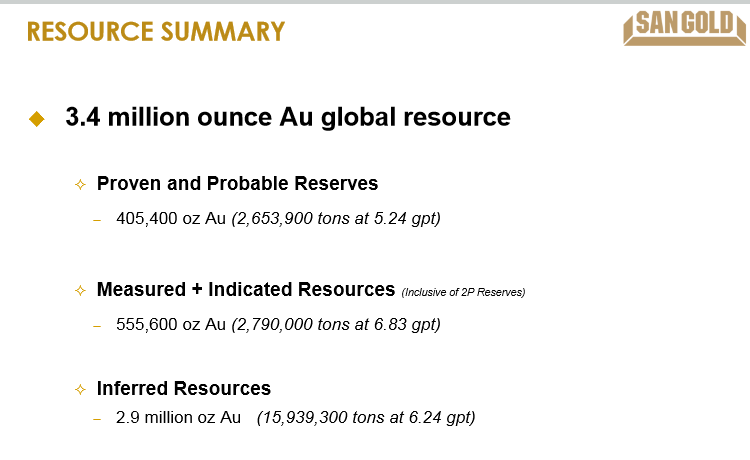
(Source: Investor presentation)
2 Management
The CEO Greg Gibson has more than 30 years of mining industry experience in Canada, the USA and Australia. Greg Gibson has been CEO since June 2014. Collectively, San Gold’s management team has over 80 years of mining experience.
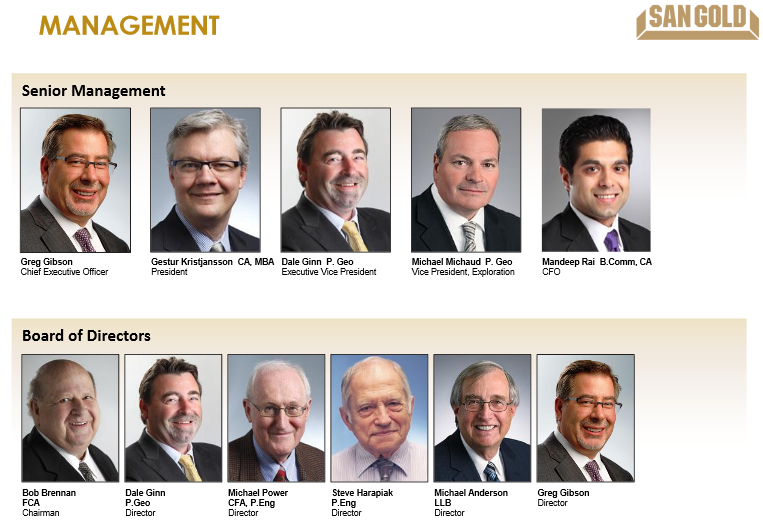
(Source: Investor presentation)
2.1 Insider Ownership
San Gold’s directors and executive officers own 0.5% of the company.
Here is a table of San Gold’s insider activity by calendar month.
| Insider buying / shares | Insider selling / shares | |
| July 2014 | 0 | 0 |
| June 2014 | 0 | 0 |
| May 2014 | 0 | 0 |
| April 2014 | 0 | 0 |
| March 2014 | 0 | 0 |
| February 2014 | 0 | 0 |
| January 2014 | 0 | 0 |
| December 2013 | 10,000 | 0 |
| November 2013 | 0 | 0 |
| October 2013 | 0 | 0 |
| September 2013 | 0 | 0 |
| August 2013 | 45,000 | 0 |
| July 2013 | 25,000 | 0 |
| June 2013 | 95,000 | 0 |
| May 2013 | 524,000 | 0 |
| April 2013 | 320,000 | 0 |
| March 2013 | 0 | 0 |
| February 2013 | 0 | 0 |
| January 2013 | 0 | 0 |
There have been 1,019,000 shares purchased and there have been zero shares sold by insiders since January 2013.
2.2 Compensation
Here is a table of the management’s compensation.
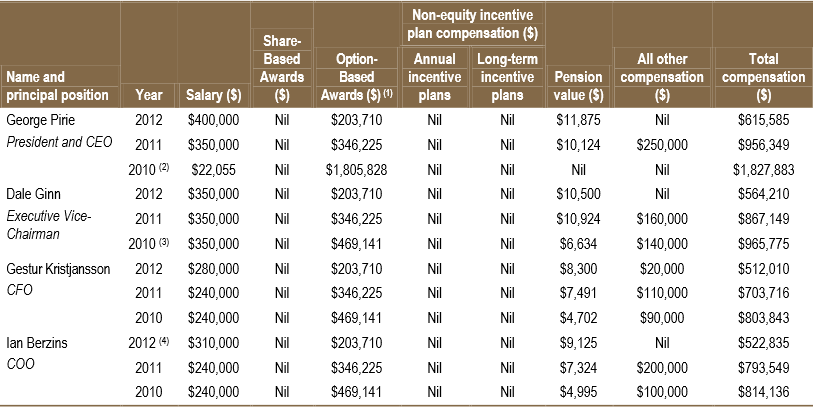
(Source: Management Information Circular)
The management’s total compensation has followed the share price.
3 Operating Summary
Here is a table of San Gold’s annual gold production since 2006.
| Year | Annual production (ounces) |
| 2006 | 1,000 |
| 2007 | 9,200 |
| 2008 | 14,000 |
| 2009 | 35,000 |
| 2010 | 43,500 |
| 2011 | 74,000 |
| 2012 | 86,500 |
| 2013 | 75,200 |
The gold production peaked in 2012.
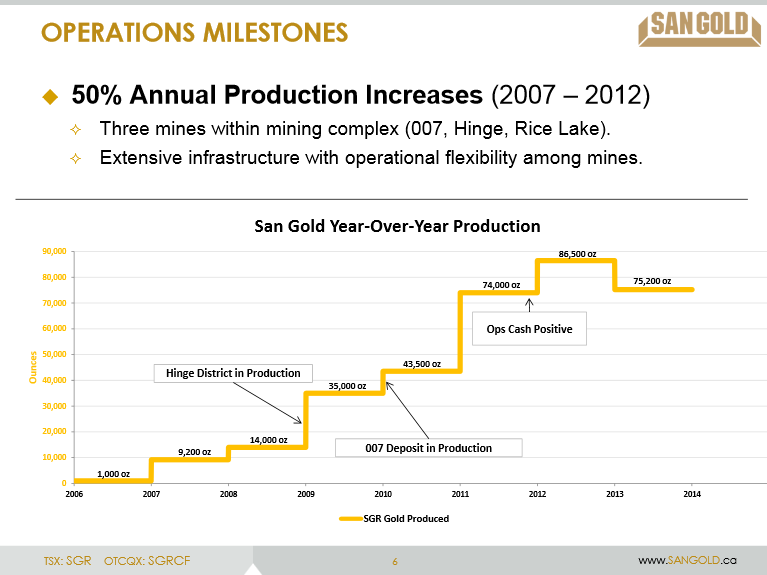
(Source: Investor presentation)
4 Financial Summary
4.1 Current Situation
San Gold reported the first-quarter financial results on May 12 with the following highlights:
| Revenue | C$14.9 million |
| Net loss | C$7.7 million |
| Cash | C$16.1 million |
| Debt | C$63.6 million |
| Gold production | 12,083 ounces |
| Total cash costs | C$1,226 per ounce |
Gold production in the first quarter of 2014 was 30% lower than gold production in the same period of 2013.
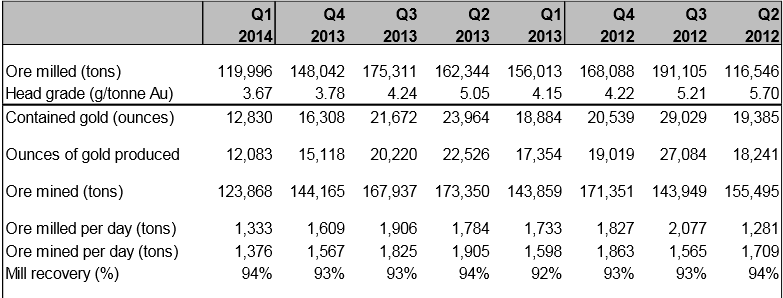
(Source: Earnings release)
4.2 Historical Developments
Here is a table of San Gold’s revenue and earnings since 2006.
| Year | 2006 | 2007 | 2008 | 2009 | 2010 | 2011 | 2012 | 2013 |
| Revenue (C$ millions) | 0.8 | 4.4 | 8.7 | 27.8 | 58.0 | 114.1 | 142.1 | 106.3 |
| Net income/loss (C$ millions) | -18.4 | -29.9 | -33.4 | -29.5 | -24.6 | -5.1 | -13.2 | -111.3 |
| EPS | -0.16 | -0.19 | -0.15 | -0.12 | -0.09 | -0.02 | -0.04 | -0.32 |
San Gold reported C$83.1 million of impairment charges in 2013.
5 Shares
Here is a table of San Gold’s number of shares since 2006.
| Year | 2006 | 2007 | 2008 | 2009 | 2010 | 2011 | 2012 | 2013 |
| Number of shares (millions) | 117.7 | 160.9 | 220.5 | 251.6 | 284.7 | 309.1 | 324.9 | 346.6 |
San Gold’s number of shares have grown 194% since 2006, but the gold production has grown 7,500%.
6 Outlook
San Gold’s near-term goal is to achieve profitability by focusing on most profitable ounces.
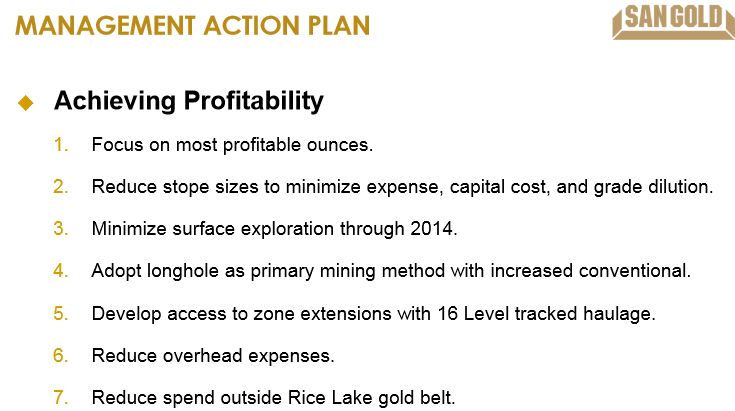
(Source: Investor presentation)
On July 21 San Gold and Kerr Mines (TSX:KER) announced that they had entered into a non-binding letter of intent to merge their businesses. Kerr Mines’ high grade Copperstone mine will be similar in size to the Rice Lake mine.
7 Risks
The two main risks are negative earnings and the gold price. San Gold has reported negative earnings since inception. San Gold’s total cash costs were C$1,226 per ounce in the first quarter. San Gold is also a penny stock.
8 Conclusion
San Gold is currently trading at a P/B ratio of 0.39. I believe the stock could have at least 100% upside potential during the next 12 months.
(Source: Investor presentation)
Disclosure: The author is long TSX:SGR