

Since late 2012, the short float on Western Union (NYSE:WU) has grown steadily from a reasonable 3% to what is now 15.04%. –Â higher than 90% of the market. The short float grew ~6% in 2013, another 3.7% in 2014, and in the first 3 months of this year it has grown another ~2%. Our analysis is traditionally based on a collection of value and growth metrics that have been empirically proven to correlate to stock returns, and in these areas WU is an attractive option. However, studies have also shown that "smart money" indicators also predict stock returns, and fortunately our coverage has pointed out this inconsistency with WU. We're not in the business of speculating as to why this may be happening –Â though we'd love to hear your hypotheses in the comments –Â but rather wanted to highlight this fact to investors who may be considering taking a position in this otherwise attractive stock.

Source: GuruFocus
(Note: GuruFocus measures short interest using % of float; we use % of shares outstanding, thus the slightly different values.)
Based on traditional value metrics that have been empirically shown to predict stock returns, Western Union is undervalued relative to the market. WU has a solid growth profile and hasn't missed a Wall St. consensus earnings estimate since 2008. Other than the fact that the "smart money" is going against the stock, WU looks like an attractive buy. Again, the metrics used to highlight this have been empirically shown to predict returns and are thus extremely important to analyze. As we go through the report, we'll provide links to the academic papers or books that underpin our analysis so investors can see themselves why each metric is important. Investors looking to dig deeper into academic research can check out our post here, which outlines the major academics and their research.
Valuation Breakdown
We'll start with an analysis of WU's valuation profile, looking at five valuation metrics each with a strong predictive ability. This is important to look at as Nobel Laureate Eugene Fama showed that "value stocks have higher average returns than growth stocks." WU's valuation profile is shown below:
(click to enlarge)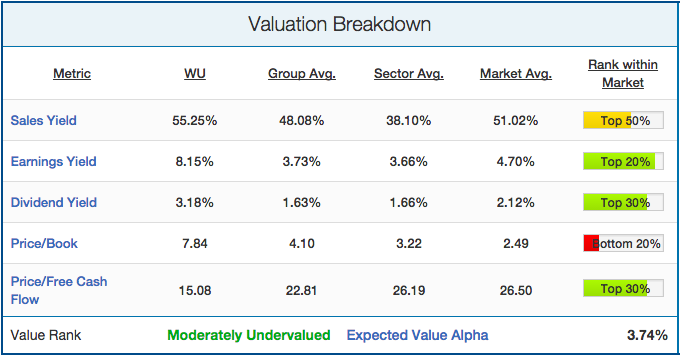
There are a few takeaways from WU's valuation breakdown:
- A strong earnings yield (inverse of P/E)
- A strong dividend yield (important to note as it makes the short more expensive)
- It's undervalued on a free cash flow basis but relatively expensive on a book value basis.
At 8.15% earnings yield, WU is in the 90th percentile of its IT Services group, the 92nd percentile of the IT sector and the 86th percentile of the market. Its dividend yield of 3.18% is nearly twice its group average, and places it in the top 30% of stocks in the market (making it one of the more expensive stocks to short). Finally, though the stock looks expensive trading at 7.84 times its book value, it's important to note that this is still lower than the 8.30 Price/Book ratio that it traded at this time last year. Finally, on a free cash flow basis, WU looks cheap at only 15 times free cash. Looking at these value metrics alone, WU is moderately undervalued and should outperform the market over the next 12 months.
Growth Breakdown
There is a variety of different growth metrics that have been shown to predict stock returns. Most important among them is price momentum. Winning stocks keep winning (based on 6-month price performance), and losing stocks keep losing. As outlined in James O'Shaughnessy's book What Works on Wall Street, EPS growth and return on equity/assets were also shown to have predictive ability, albeit to a lesser extent. Western Union's growth breakdown is shown below: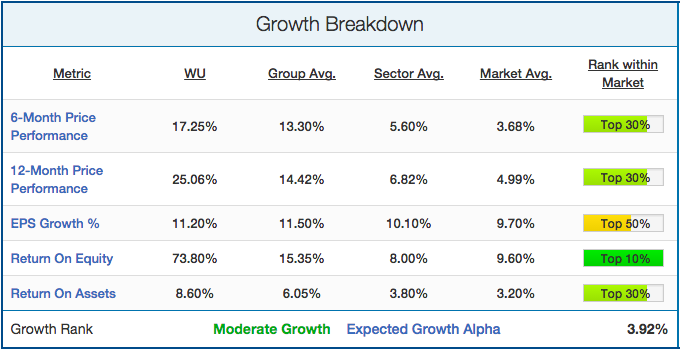 Source
Important takeaways from WU's growth breakdown:
- Strong 6-month and 12-month price performances (makes this an even more expensive short)
- Exceptionally strong ROE
- Strong ROA
The IT services group has been a strong performer over the past year, particularly the last six months, and WU is no exception. Its price momentum shows little signs of waning (up ~10% since the start of the year), as the company continues to beat earnings estimates. The 17.25% and 25.06% price gains over the last 6 and 12 months, respectively, mark huge potential losses for those short sellers who have been waiting to get out of their position. Its ROE of 73.80% is stellar, putting the stock in the 93rd percentile of its group, and the 96th percentile of the market as a whole. Its ROA at 8.60% is less impressive, but still a strong indicator of a well-run business. Based on these metrics, WU has a moderate growth profile and should outperform the market in the next 12 months.
Earnings Breakdown
Next, we'll see how Western Union has been performing relative to analyst expectations recently. We've found through historical backtesting that stocks that have a history of beating analyst expectations are much more likely to beat estimates in the future. This is key as stocks that beat analyst estimates often see a jump in price, and vice versa for earnings misses. WU's earnings estimate breakdown is shown below: Source
WU has an eerily consistent history of beating consensus EPS estimates. Oddly enough, WU hasn't missed an EPS consensus estimate since Q3 2008 when it missed by a cent. Since then, it has beaten estimates 15 times and met them equally 6 times (neither beating or missing). With that in mind, we feel that there is little likelihood of WU missing EPS, and we expect them to beat the Wall Street consensus of $0.38. Management appears less concerned with consistently beating revenue estimates, proven by its track record of only beating 5 of the last 10 quarters. Given the uncertainty of WU beating revenue estimates, our overall pre-earnings recommendation is a hold. Important to note that a lot can change in the 52 days until WU is expected to release earnings.
Smart Money Breakdown
In addition to value and momentum, we will also analyze how the "smart money" on the Street is playing Western Union. "Smart money" stakeholders are short sellers, company insiders, and institutions. Each of these stakeholders tend to be much more sophisticated than the average investor due to their inherent advantages. Company insiders know the company inside out, while institutions and short sellers spend millions of dollars on research. We have found loads of academic research showing that short sellers,company insiders, and institutions all predict stock returns. WU's "smart money" breakdown is shown below: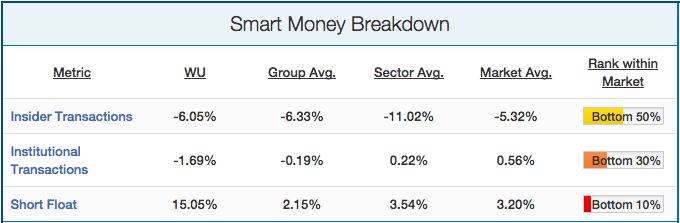
As noted before, this is where WU becomes particularly interesting. Given its dividend yield and recent price performance, it's not abundantly clear why Western Union's short float is so high. This should be a concern for long-term investors. Another cause for concern is the fact that both institutions and insiders are selling from their positions.
Conclusion
Though we feel good about Western Union's value and growth prospects, we don't feel comfortable taking a long-term position on the company without knowing why its short float has been growing for so long and has reached such a high level. Until we see that trend reverse, and the short float consistently shrink, we won't consider the potential value and growth prospects for the stock. We can't explain why this short float is growing but rather wanted to point it out and let potential investors make their own decisions as to whether it's a major cause for concern.