

I’ve recently written a couple of posts on for-profit colleges, Apollo Education (APOL, Financial) and Strayer University (STRA, Financial). The topic of student debt has been widely discussed in the media and the resulting bad publicity is one of the primary reasons for the enrollment declines at for-profit colleges. That made me want to study the issue, and I was lucky enough to have found a paper published by the Federal Reserve Bank of New York titled “Student Loan Borrowing and Repayment Trends, 2015”.
The paper's main reason for studying student borrowing is because student debt has a material effect on the broader economy in variables such as household formation, homeownership, consumption, disposable income, etc.
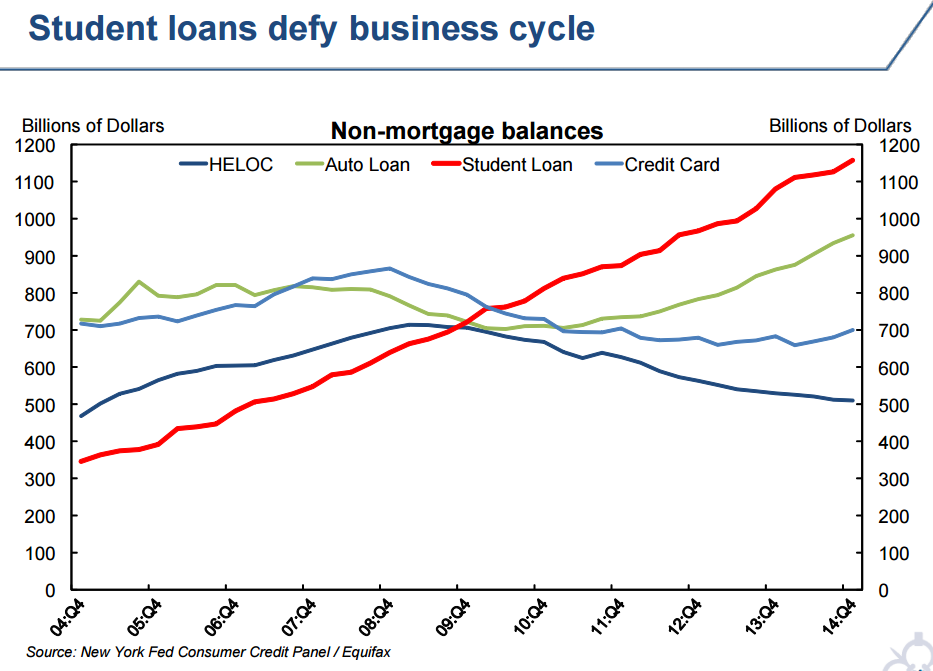
The above chart shows that student debt grew throughout the Great Recession as other forms of debt declined in the 2008 timeframe. The reason is because student loans are federal and borrowing standards were not tightened. The requirements for other loans tightened dramatically, which made non-student debt loans difficult to obtain. The explosion of student debt from 2004 to 2014 resulted from a combination of more borrowing per student, as well as more students obtaining loans. There was an increase of 89% for the number of borrowers and a 77% increase for average amount borrowed during that timeframe. College enrollment grew 20% from 2005 to 2010, a pace not seen since the 1970’s.
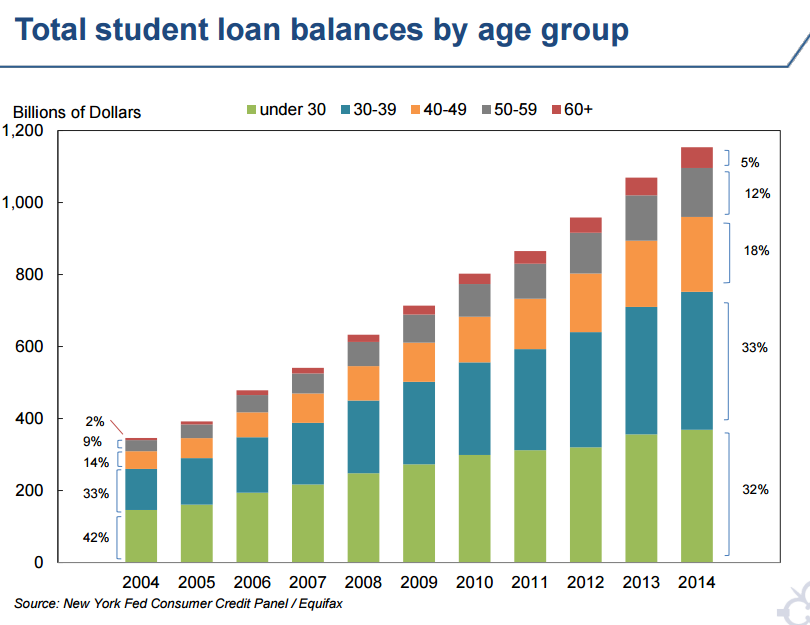
Here’s the student debt trend broken down by age group in the chart above. It’s interesting that in 2014 the “30-39” age bracket (33%) had more debt than the “under 30” age bracket (32%).
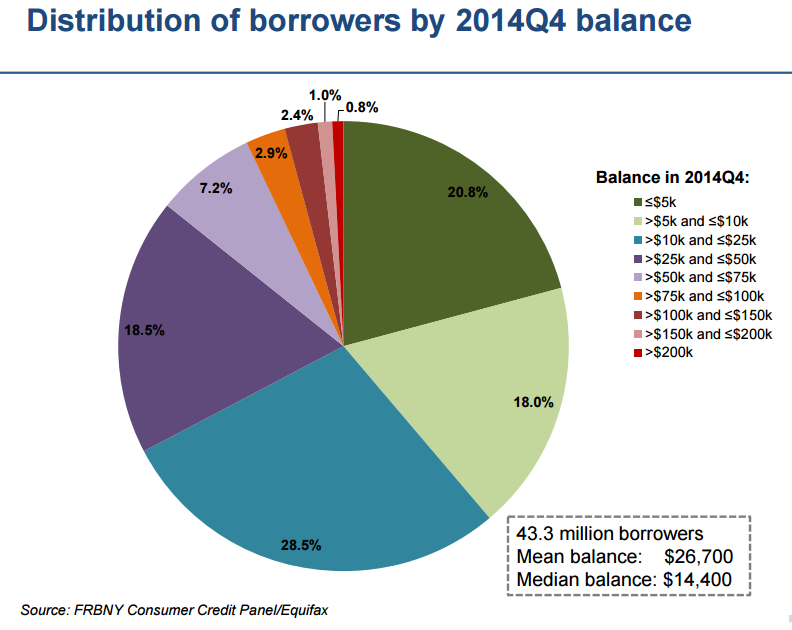
The chart above shows that there are 43.3 million borrowers with an average balance of $26,700 and a median balance of $14,400.
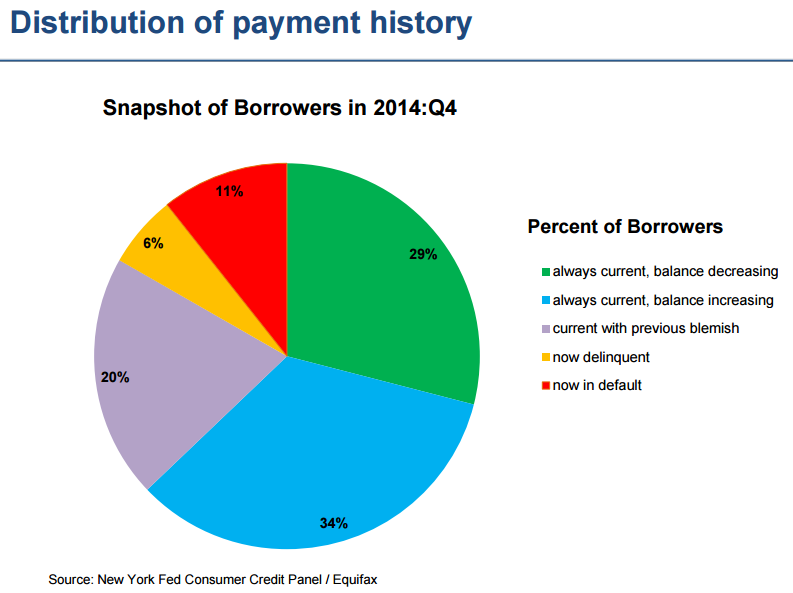
Twenty-nine percent of borrowers were current on their student debt and were paying off the balance. The other 71% had experienced problems with payments in the past, were having problems keeping their balances from growing, or were in default.
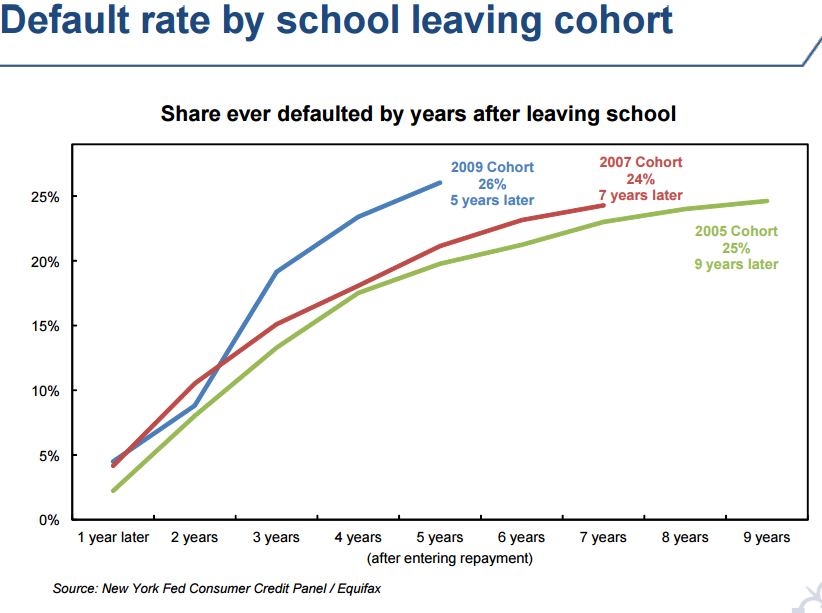
The cohort default rate for cohorts leaving school in 2005, 2007 and 2009 all are near 25%.
Final thoughts
As noted above, 43.3 million student borrowers had an average balance of $26,700 and a median balance of $14,400. Since the report started off by saying that student debt “appears to have significant effects on macroeconomic outcomes (household formation, homeownership, consumption)”, I wanted to put some other statistics for a frame of reference.
- Most first time homebuyers are not married and the median age is 32.5.
- There were approximately 87 million homeowners in 2012and the average down payment on a house in 2014 was approximately $32,000.
- From credible.com, here’s a chart on interest rates for different types of student debt.
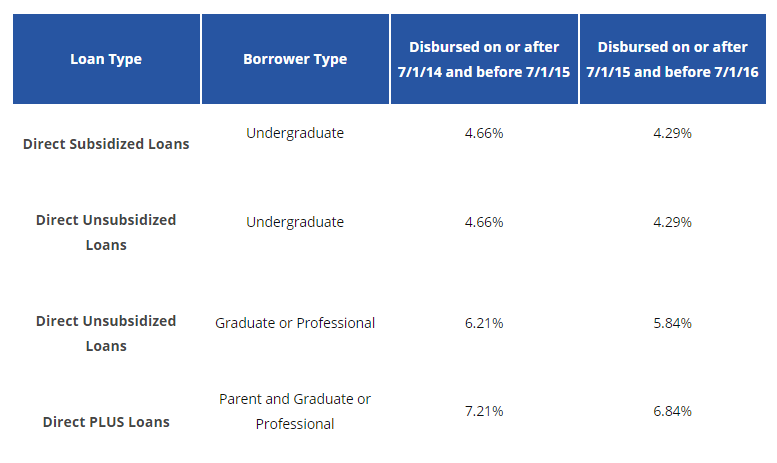
- If we assume a median student borrower has to pay 5% in interest per year, that means their annual interest payment is ($14,400 x 5%), or $720.
- For me, the most sobering lesson learned from this report was the first chart depicting student debt growth. It shows a straight line to the right and totals $1.2 trillion in 2015.