
This week we’ve been examining the various studies that have considered book value as a predictor of future investment returns, and methods for “juicing” or improving its performance. Josef Lakonishok, Andrei Shleifer, and Robert Vishny’s landmark 1994 study Contrarian Investment, Extrapolation, and Risk examined book value in the context of a larger investigation into the performance of value stocks relative to glamour stocks in the United States. Book value was one of four one-variable metrics used to classify a stock as “value” or “glamour” (the others were cash flow, earnings and 5-year average growth rate of sales). Lakonishok, Shleifer, and Vishny (LSV) argue that value strategies produce superior returns because most investors don’t fully appreciate the phenomenon of mean reversion, which leads them to extrapolate past performance too far into the future. To exploit the flaw in intuitive forecasts – you know how I love a counter-intuitive strategy – they argue that contrarian investors should sell stocks with high past growth as well as high expected future growth and buy stocks with low past growth and as well as low expected future growth. In practice, this means adding to each of the four one-variable value metrics a second dimension to further tune the selection process. The result is LSV’s Two-Dimensional Classification.
Contrarian Investment, Extrapolation, and Risk
In Contrarian Investment, Extrapolation, and Risk LSV define “value strategies” as “buying stocks that have low prices relative to earnings, dividends, book assets, or other measures of fundamental value.” They argue that, while there is some agreement that value strategies produce higher returns, the interpretation of why they do so is more controversial. The paper is a response to Fama and French’s 1992 paper, The Cross-Section of Expected Stock Returns, which argued that value strategies produce abnormal returns only because they are fundamentally riskier. LSV seek to demonstrate that value strategies yield higher returns because these strategies “exploit the suboptimal behavior of the typical investor” and “not because these strategies are fundamentally riskier.” (LSV’s research was updated this year by The Brandes Institute, who extended LSV’s research through to June 2008, creating a 40-year comparison of the relative performance of value and glamour stocks.)
LSV test two potential explanations for the outperformance of value stocks over glamour stocks:


As the four panels make clear, value outperforms glamour in rank order and regardless of the simple one-variable classification chosen. LSV attribute the outperformance to the failure of investors to formulate their predictions of the future without a “full appreciation of mean reversion.”
Anatomy of a Contrarian Strategy: LSV’s Two-Dimensional Classification
According to LSV, to exploit this flaw of intuitive forecasts, contrarian investors should sell stocks with high past growth as well as high expected future growth and buy stocks with low past growth and as well as low expected future growth.
LSV test the Two-Dimensional Classifications in a similar manner to the one-variable classifications above. At the end of each April between 1968 and 1989, 9 portfolios of stocks are formed. The stocks are independently sorted into ascending order in 3 groups (rather than deciles, for the obvious reason – 9 annual portfolios is easier to track than 100): 1. the bottom 30%, 2. the middle 40%, and 3. the top 30% based on each of two variables. The sorts are for 5 pairs of variables: C/P and GS, B/M and GS, E/P and GS, E/P and B/M and B/M and C/P. Depending on the two variables used for classification, the Valueportfolio either refers to the portfolio containing stocks ranked in the top group (3.) on both variables from among C/P, E/P, or B/M, or else the portfolio containing stocks ranking in the top group on one of those variables and in the bottom group (1.) on GS and vice versa for Glamour. (For the purposes of this post, I’m including only those examining B/M as one of the variables. The others are, however, well worth considering. Value determined on the basis C/P or E/P combined with GS produced slightly higher cumulative returns averaged across all firms for the period of the study. Interestingly, this phenomenon reversed in large stocks, with B/M-based strategies producing slightly higher cumulative returns in large stocks.):


These tables demonstrate that, within the set of firms whose B/M ratios are the highest (in other words, the lowest price-to-book value), further sorting on the basis of another value variable – whether it be C/P, E/P or low GS – can enhance returns. This is LSV’s Two-Dimensional Classification. LSV conclude that value strategies based jointly on past performance and expected future performance produce higher returns than “more ad hoc strategies such as that based exclusively on the B/M ratio.” The strategy is quite useful. It can be applied to large stocks, which means that it can be used to implement trading strategies for larger and institutional investors, and will continue to generate superior returns.
Next we examine Joseph D. Piotroski’s F_SCORE as a means for juicing P/B.
Greenbackd
http://greenbackd.com/
Contrarian Investment, Extrapolation, and Risk
In Contrarian Investment, Extrapolation, and Risk LSV define “value strategies” as “buying stocks that have low prices relative to earnings, dividends, book assets, or other measures of fundamental value.” They argue that, while there is some agreement that value strategies produce higher returns, the interpretation of why they do so is more controversial. The paper is a response to Fama and French’s 1992 paper, The Cross-Section of Expected Stock Returns, which argued that value strategies produce abnormal returns only because they are fundamentally riskier. LSV seek to demonstrate that value strategies yield higher returns because these strategies “exploit the suboptimal behavior of the typical investor” and “not because these strategies are fundamentally riskier.” (LSV’s research was updated this year by The Brandes Institute, who extended LSV’s research through to June 2008, creating a 40-year comparison of the relative performance of value and glamour stocks.)
LSV test two potential explanations for the outperformance of value stocks over glamour stocks:
LSV test the contention that value strategies produce superior returns because investors extrapolate past performance too far into the future by examining simple one-variable classifications of glamour and value stocks. Glamour stocks are those that “have performed well in the past,” and “are expected by the market to perform well in the future.” Value stocks are those that “have performed poorly in the past and are expected to continue to perform poorly.” The stocks are classified on the basis of one of four variables: book-to-market (B/M, the inverse of price-to-book), cash flow-to-price (C/P), earnings-to-price (E/P), and 5-year average growth rate of sales (GS). LSV examine 2,700 firms on the NYSE and AMEX between 1968 and 1989. At the end of each April, they rank each stock on the basis of the variable tested (B/M, C/P etc) and then divide the stocks into deciles. Each decile is treated as a portfolio and held for 5 years. LSV track the performance of each decile portfolio in each of the 5 years and present the results as follows (Rt is the average return in year t over the 5 years after formation, CR5 is the compounded 5-year return assuming annual rebalancing. SAAR is the average annual size-adjusted return computed over the 5 years after formation. The Glamour portfolio is the decile portfolio containing stocks ranked lowest on B/M, C/P, or E/P, or highest of GS and vice versa for theValue portfolio):
- LSV’s contrarian model, which argues that value strategies produce superior returns because investors extrapolate past performance too far into the future.
- Fama and French’s contention that value stocks are fundamentally riskier than glamour stocks. This second potential explanation is outside the scope of this post, but is dealt with in some detail in the paper. I encourage you to read it if you’re interested in the efficient markets debate.
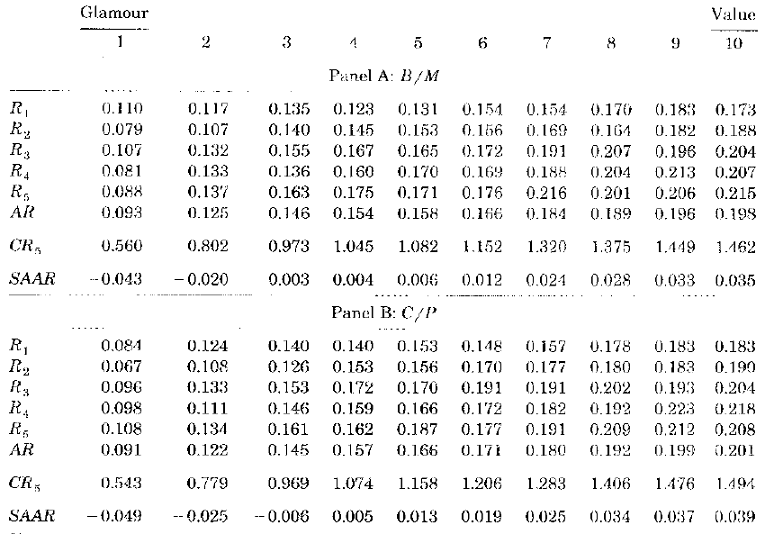

As the four panels make clear, value outperforms glamour in rank order and regardless of the simple one-variable classification chosen. LSV attribute the outperformance to the failure of investors to formulate their predictions of the future without a “full appreciation of mean reversion.”
That is, individuals tend to base their expectations on past data for the individual case they are considering without properly weighting data on what psychologists call the “base rate,” or the class average. Kahneman and Tversky (1982, p. 417) explain:
One of the basic principles of statistical prediction, which is also one of the least intuitive, is that extremeness of predictions must be moderated by considerations of predictability… Predictions are allowed to match impressions only in the case of perfect predictability. In intermediate situations, which are of course the most common, the prediction should be regressive; that is, it should fall between the class average and the value that best represents one’s impression of the case at hand. The lower the predictability the closer the prediction should be to the class average. Intuitive predictions are typically nonregressive: people often make extreme prediction on the basis of information whose reliability and predictive validity are known to be low.
Anatomy of a Contrarian Strategy: LSV’s Two-Dimensional Classification
According to LSV, to exploit this flaw of intuitive forecasts, contrarian investors should sell stocks with high past growth as well as high expected future growth and buy stocks with low past growth and as well as low expected future growth.
Prices of these stocks are likely to reflect the failure of investors to impose mean reversion on growth forecasts.
LSV test the Two-Dimensional Classifications in a similar manner to the one-variable classifications above. At the end of each April between 1968 and 1989, 9 portfolios of stocks are formed. The stocks are independently sorted into ascending order in 3 groups (rather than deciles, for the obvious reason – 9 annual portfolios is easier to track than 100): 1. the bottom 30%, 2. the middle 40%, and 3. the top 30% based on each of two variables. The sorts are for 5 pairs of variables: C/P and GS, B/M and GS, E/P and GS, E/P and B/M and B/M and C/P. Depending on the two variables used for classification, the Valueportfolio either refers to the portfolio containing stocks ranked in the top group (3.) on both variables from among C/P, E/P, or B/M, or else the portfolio containing stocks ranking in the top group on one of those variables and in the bottom group (1.) on GS and vice versa for Glamour. (For the purposes of this post, I’m including only those examining B/M as one of the variables. The others are, however, well worth considering. Value determined on the basis C/P or E/P combined with GS produced slightly higher cumulative returns averaged across all firms for the period of the study. Interestingly, this phenomenon reversed in large stocks, with B/M-based strategies producing slightly higher cumulative returns in large stocks.):


These tables demonstrate that, within the set of firms whose B/M ratios are the highest (in other words, the lowest price-to-book value), further sorting on the basis of another value variable – whether it be C/P, E/P or low GS – can enhance returns. This is LSV’s Two-Dimensional Classification. LSV conclude that value strategies based jointly on past performance and expected future performance produce higher returns than “more ad hoc strategies such as that based exclusively on the B/M ratio.” The strategy is quite useful. It can be applied to large stocks, which means that it can be used to implement trading strategies for larger and institutional investors, and will continue to generate superior returns.
Next we examine Joseph D. Piotroski’s F_SCORE as a means for juicing P/B.
Greenbackd
http://greenbackd.com/