
This week we look at the EU GDP numbers showing a pretty fragile and mixed recovery, then US retail sales showing a back-loading of holiday spending. Then we look at some of the China data that came out over the week, focusing on inflation data, and international trade stats. Finally we look at Aussie employment stats which shows continuing strength down under.
The key takeaways or themes to pull out of this edition are probably first of all that things are continuing to recover, but at a very gradual pace - and at a very mixed pace. Some positive signs could almost be called false positives, and some arguably negative signs could in fact be pointing to stronger long term growth.
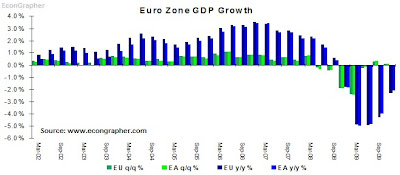
1. EU GDP - gradual improvement
The EU saw 0.1% growth q/q in Q4 2009, this was against expectations of 0.4% (the same as in Q3). Year on year the declines moved closer to -2% than the previous -4%. Of course it was a mixed picture again too. The leading economies of Germany and France even differed this time with Germany recording 0 growth q/q while France recorded its 3rd quarterly gain. Of course you're probably wondering about Greece; the numbers were -0.8% q/q and -2.6% y/y, which on both case was the 3rd quarter of worsening results. So the overall message from the EU is a recovery; but a slow one, a fragile one, and an uneven one.
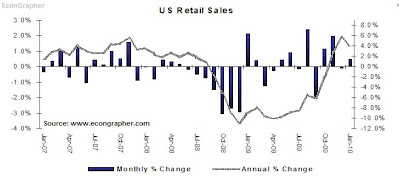
2. US Retail Sales - back-loaded holiday spending?
The US just released retail sales figures for January, month on month retail sales were up 0.5%, matching consensus, and showing possible back-loading of holiday spending as people went to town to spend their gift vouchers and cash presents. Year on Year the growth rate slipped slightly to 4% (versus 5.7% in December). Overall retail sales figures show consumer spending recovering at a gradual pace - and this is good, in fact the last thing you want to see is a rapid increase in consumer spending in the US; what's more important is that the personal savings rate starts to pick up, this is a requirement of more sustainable long term growth...
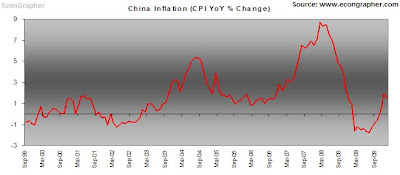
3. China CPI - signs of inflation coming through
China released its CPI figures this week with the January figure up 1.5% year on year, this was below consensus of 2% and less than the previous 1.9%. This is the 3rd positive figure in a row, and when juxtaposed with a few other data points leads to a view of increasing inflation. Indeed it matches up with the moves made on the tightening front so far with the increases in the required reserve ratio, government bond issues, and words of caution by the authorities to the banks. If this trend persists we could even see a lift in the official interest rate sometime in the first half of 2010.
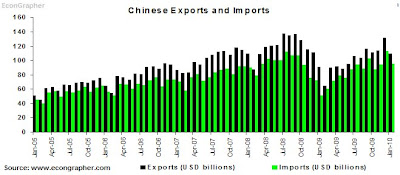
4. China International Trade - recovery strengthening
China also released its trade stats for January, showing a continued recovery, albeit with slightly lower figures due to the whole January/February Chinese new year period. Exports came in at 109.5 and imports 95.3, which compare to January figures in 2009 of 90.5 and 51.3 respectively. Distortions aside, the story told in the chart below is one of visible improvement. Though some of it can be explained by the inventory cycle and low currency driving exports, and stimulus spending and commodity price recovery driving imports. This plays into the debate about the yuan; will the authorities let the yuan appreciate a little this year? 3%? 6%? or will they increase wages instead as a means of encouraging domestic demand over exports?
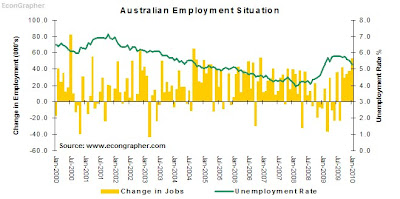
5. Australian Employment - the Aussies have still got it
Australia beat estimates again, and showed further acceleration of jobs growth with 52.7k new jobs vs consensus of 15k, and December figures of 37.5k. The unemployment rate also shrank to 5.3%, from 5.5% in December and off of the peak of 5.8%. Thus things are still looking pretty good in Australia. It's also worth noting that the RBA paused on its tightening cycle in February, opting instead to leave rates at still stimulatory levels, due to the banks passing on all the increase and a little bit more, and views that inflation had been kept relatively in check for the time being. Figures like this though will only add pressure for the RBA to return to its tightening path from still "below average levels" sooner or later.
Summary
To sum up, the EU economies are gradually recovering, but at a very subdued, fragile, and mixed pace across the member states. There's still many risks to the recovery over there, including the most talked about, Greece fiscal situation. Over in the US, meanwhile, retail sales are pointing to a continued yet below trend recovery in consumer spending, however the US consumer is still relatively weak.
In China, the CPI figures are showing a pick up in the pace of inflation, confirmed with other data points, and gradual moves toward tightening. China has also seen a steady improvement in international trade volumes since the lows of 2009, and while the drivers may be temporary it has the potential to push forward momentum, and adding to the case for a potential move on the yuan. Meanwhile in Australia - a country increasingly coupled to the Chinese economy, rapid and continued job growth points to a strengthening recovery and likely continuation of tightening in the medium term.
So there you have it, a tale of a gradual recovery, a fragile recovery, and an uneven recovery. It's also one of opportunity, that is, opportunity for change. It's possible that the recovery will herald some rebalancing and structural changes. For example it may lead to the Chinese looking more internally for growth, likewise it could lead to higher savings rates in the US; and less reliance on external financing.
Sources:
1. Eurostat http://epp.eurostat.ec.europa.eu
2. US Census Bureau http://www.census.gov/retail/
3. National Bureau of Statistics http://www.stats.gov.cn/english
4. Trading Economics http://www.tradingeconomics.com
5. Australian Bureau of Statistics http://abs.gov.au
Article Source: http://econgrapher.site1.net.nz/top5graphs13feb.html
The key takeaways or themes to pull out of this edition are probably first of all that things are continuing to recover, but at a very gradual pace - and at a very mixed pace. Some positive signs could almost be called false positives, and some arguably negative signs could in fact be pointing to stronger long term growth.
1. EU GDP - gradual improvement
The EU saw 0.1% growth q/q in Q4 2009, this was against expectations of 0.4% (the same as in Q3). Year on year the declines moved closer to -2% than the previous -4%. Of course it was a mixed picture again too. The leading economies of Germany and France even differed this time with Germany recording 0 growth q/q while France recorded its 3rd quarterly gain. Of course you're probably wondering about Greece; the numbers were -0.8% q/q and -2.6% y/y, which on both case was the 3rd quarter of worsening results. So the overall message from the EU is a recovery; but a slow one, a fragile one, and an uneven one.

2. US Retail Sales - back-loaded holiday spending?
The US just released retail sales figures for January, month on month retail sales were up 0.5%, matching consensus, and showing possible back-loading of holiday spending as people went to town to spend their gift vouchers and cash presents. Year on Year the growth rate slipped slightly to 4% (versus 5.7% in December). Overall retail sales figures show consumer spending recovering at a gradual pace - and this is good, in fact the last thing you want to see is a rapid increase in consumer spending in the US; what's more important is that the personal savings rate starts to pick up, this is a requirement of more sustainable long term growth...

3. China CPI - signs of inflation coming through
China released its CPI figures this week with the January figure up 1.5% year on year, this was below consensus of 2% and less than the previous 1.9%. This is the 3rd positive figure in a row, and when juxtaposed with a few other data points leads to a view of increasing inflation. Indeed it matches up with the moves made on the tightening front so far with the increases in the required reserve ratio, government bond issues, and words of caution by the authorities to the banks. If this trend persists we could even see a lift in the official interest rate sometime in the first half of 2010.

4. China International Trade - recovery strengthening
China also released its trade stats for January, showing a continued recovery, albeit with slightly lower figures due to the whole January/February Chinese new year period. Exports came in at 109.5 and imports 95.3, which compare to January figures in 2009 of 90.5 and 51.3 respectively. Distortions aside, the story told in the chart below is one of visible improvement. Though some of it can be explained by the inventory cycle and low currency driving exports, and stimulus spending and commodity price recovery driving imports. This plays into the debate about the yuan; will the authorities let the yuan appreciate a little this year? 3%? 6%? or will they increase wages instead as a means of encouraging domestic demand over exports?

5. Australian Employment - the Aussies have still got it
Australia beat estimates again, and showed further acceleration of jobs growth with 52.7k new jobs vs consensus of 15k, and December figures of 37.5k. The unemployment rate also shrank to 5.3%, from 5.5% in December and off of the peak of 5.8%. Thus things are still looking pretty good in Australia. It's also worth noting that the RBA paused on its tightening cycle in February, opting instead to leave rates at still stimulatory levels, due to the banks passing on all the increase and a little bit more, and views that inflation had been kept relatively in check for the time being. Figures like this though will only add pressure for the RBA to return to its tightening path from still "below average levels" sooner or later.

Summary
To sum up, the EU economies are gradually recovering, but at a very subdued, fragile, and mixed pace across the member states. There's still many risks to the recovery over there, including the most talked about, Greece fiscal situation. Over in the US, meanwhile, retail sales are pointing to a continued yet below trend recovery in consumer spending, however the US consumer is still relatively weak.
In China, the CPI figures are showing a pick up in the pace of inflation, confirmed with other data points, and gradual moves toward tightening. China has also seen a steady improvement in international trade volumes since the lows of 2009, and while the drivers may be temporary it has the potential to push forward momentum, and adding to the case for a potential move on the yuan. Meanwhile in Australia - a country increasingly coupled to the Chinese economy, rapid and continued job growth points to a strengthening recovery and likely continuation of tightening in the medium term.
So there you have it, a tale of a gradual recovery, a fragile recovery, and an uneven recovery. It's also one of opportunity, that is, opportunity for change. It's possible that the recovery will herald some rebalancing and structural changes. For example it may lead to the Chinese looking more internally for growth, likewise it could lead to higher savings rates in the US; and less reliance on external financing.
Sources:
1. Eurostat http://epp.eurostat.ec.europa.eu
2. US Census Bureau http://www.census.gov/retail/
3. National Bureau of Statistics http://www.stats.gov.cn/english
4. Trading Economics http://www.tradingeconomics.com
5. Australian Bureau of Statistics http://abs.gov.au
Article Source: http://econgrapher.site1.net.nz/top5graphs13feb.html