
Covidien (COV, Financial) is a large, multi-national health care company diversified into medical devices, pharmaceuticals, and medical supplies. The company was spun off from Tyco in 2007.
Analysts expect approximately 10% compounded EPS growth over the next two years, based on 2011 and 2012 estimates.
The balance sheet is mediocre, with a moderate LT Debt/Equity ratio, fair interest coverage ratio, but a lot of goodwill from acquisitions.
The dividend yield is pretty low, at only 1.70% with a low payout ratio, and due to the spin-off has no substantial dividend history. This being the case, many dividend investors won’t bite, but with growth in an industry with positive long-term prospects, investors can potentially look forward to high capital gains and a high yield on cost.
Overall, with a P/E of 15.4, I find Covidien to be a reasonably attractive investment choice, if not for dividend investors then at least for value or GARP investors. The dividend is a bit low for my liking (especially since I have the goal of increasing my average portfolio yield this year), but this stock is at least worth a look for anyone’s portfolio.
Of the $10.7 billion in total sales, $6.170 billion (58%) came from the United States, $2.579 billion (24%) came from Europe, $1.368 (13%) came from Asia-Pacific, and $0.560 billion (5%) came from elsewhere in the Americas.
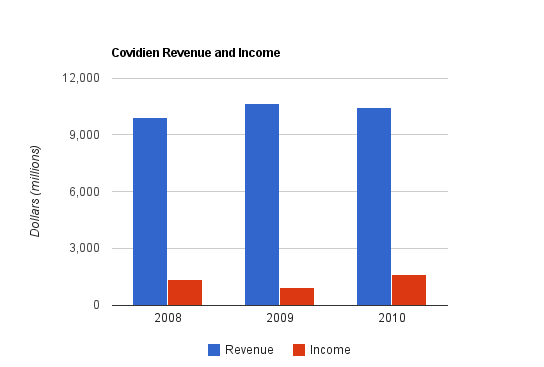
Revenue is shown for the three full years that Covidien has been a public company.
Earnings are shown for the three full years that Covidien has been a public company.
Operational Cash Flow is shown for the three full years that Covidien has been a public company.
Earnings and Cash Flow were a bit erratic in 2008 and 2009, but it can be seen that they varied inversely to one another. 2008 saw substantial earnings but low cash flow, and 2009 saw substantial cash flow but low earnings. In 2008 there was a billion dollar deduction in non-cash items, leading to low operational cash flow figures, and in 2009 there was a $400 billion positive change in working capital.
P/B: 2.64
ROE: 19
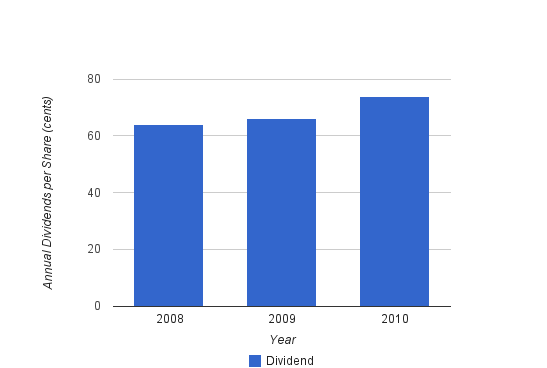
Based on the calender year, Covidien increased its dividend by 3% in 2009 and 12% in 2010.
Covidien began its dividend history by paying $0.16 towards the end of 2007. It then paid $0.16 per quarter all four quarters of calendar year 2008, totaling $0.64 in dividends per share for that year. In calendar year 2009, the company paid $0.16 per quarter for each of the first three quarters, and then finished the year with a $0.18 payment. In calendar year 2010, the company paid $0.18 for each of the first three quarters and then finished the year with a $0.20 payment. The company ends its fiscal year in September of each year, so the quarterly payments of $0.16, $0.18, and $0.20 align with their fiscal years and result in a 12.5% and 11.1% increase respectively. Annualized, this represents 12% compounded dividend growth.
Covidien’s top medical device product lines are Endomechanical Instruments ($2,139 million in 2010 sales), Energy Devices ($992 million) Soft Tissue Repair Products ($854 million), Oximetry and Monitoring Products ($755 million), Airway and Ventilation Products ($770 million), and Vascular Products ($810 million). The sales of the Vascular Products line are up 41% over 2009, and the Oximetry and Monitoring Products line and Energy Devices line both had double-digit growth as well.
The pharmaceutical segment generally experienced mild declines in sales compared to the fair growth of the medical device segment.
As per the Q4 2010 financial report, the company acquired Aspect, ev3, and Somanetics, and divested their specialty chemicals business, U.S. nuclear pharmacies, and sleep and oxygen product lines. More than 20 new products were launched in 2010.
These early years as an independent company seem to have mostly focused on product portfolio tuning and strategic streamlining, rather than focusing on short-term annual growth. Still, the company’s robust free cash flow allowed it to return value to shareholders in the form of both dividends and share repurchases. These changes have set the company up to perform well in 2011, 2012, and later, as their pipeline is strong and they’ve focused on portfolio strengths.
2010 EPS was $3.24, and analysts predict EPS to be $3.57 and $3.94 in 2011 and 2012 respectively. Analyst accuracy can vary wildly, but assuming these numbers are reasonably accurate, that translates into compounded EPS growth of a bit over 10%. With a P/E of over 15, this results in a forward PEG ratio of well over 1. Even if the dividend yield is added to the growth value, the PEG ratio is still over 1. Admittedly, the PEG ratio is less than useful when companies experience low growth, and only moderately useful when companies experience moderate growth like Covidien, but it serves as a useful check.
If interested in the stock, it might be worth adding to a watch list to look for potential stock price dips to enter at a better price. I don’t find the stock to be overvalued by any stretch, but one always appreciates a margin of safety.
Full Disclosure:
As of this writing, I have no position in COV.
You can see my full list of individual holdings here.
Analysts expect approximately 10% compounded EPS growth over the next two years, based on 2011 and 2012 estimates.
The balance sheet is mediocre, with a moderate LT Debt/Equity ratio, fair interest coverage ratio, but a lot of goodwill from acquisitions.
The dividend yield is pretty low, at only 1.70% with a low payout ratio, and due to the spin-off has no substantial dividend history. This being the case, many dividend investors won’t bite, but with growth in an industry with positive long-term prospects, investors can potentially look forward to high capital gains and a high yield on cost.
Overall, with a P/E of 15.4, I find Covidien to be a reasonably attractive investment choice, if not for dividend investors then at least for value or GARP investors. The dividend is a bit low for my liking (especially since I have the goal of increasing my average portfolio yield this year), but this stock is at least worth a look for anyone’s portfolio.
Overview
Covidien (NYSE: COV) was spun off from Tyco International in 2007 to become a public company. The company is divided into three business segments: Medical Devices, Pharmaceuticals, and Medical Supplies. Covidien has 42,000 employees in 60 countries that market products in 140 countries.Geography and Segment Breakdown
In 2009, the company had $10.7 billion in sales. The largest segment, Medical Devices, accounted for $6.061 billion, or 57% of sales. Pharmaceuticals, the next largest segment, accounted for $2.864 billion, or 27%. The Medical Supplies segment accounted for the remaining $1.752 billion, or 16%.Of the $10.7 billion in total sales, $6.170 billion (58%) came from the United States, $2.579 billion (24%) came from Europe, $1.368 (13%) came from Asia-Pacific, and $0.560 billion (5%) came from elsewhere in the Americas.
Revenue, Earnings, Cash Flow, and Metrics
Three years of revenue, earnings, and operational cash flow growth are shown below.Revenue Growth
| Year | Revenue |
|---|---|
| 2010 | $10.429 billion |
| 2009 | $10.677 billion |
| 2008 | $9.910 billion |
Earnings Growth
| Year | Earnings |
|---|---|
| 2010 | $1,632 million |
| 2009 | $907 million |
| 2008 | $1,361 million |
Operating Cash Flow Growth
| Year | Cash Flow |
|---|---|
| 2010 | $2,231 million |
| 2009 | $1,875 million |
| 2008 | $660 million |
Earnings and Cash Flow were a bit erratic in 2008 and 2009, but it can be seen that they varied inversely to one another. 2008 saw substantial earnings but low cash flow, and 2009 saw substantial cash flow but low earnings. In 2008 there was a billion dollar deduction in non-cash items, leading to low operational cash flow figures, and in 2009 there was a $400 billion positive change in working capital.
Metrics
P/E: 15.4P/B: 2.64
ROE: 19
Dividends
Covidien has been paying dividends since its inception as a publicly traded company, but the dividend history is obviously short. Tyco International pays/paid dividends regularly but did not regularly increase dividends. Covidien’s current yield is 1.70% with a payout ratio of less than 30%.Dividend Growth
| Year | Dividend | Yield |
|---|---|---|
| 2010 | $0.74 | 1.60% |
| 2009 | $0.66 | 1.60% |
| 2008 | $0.64 | 1.40% |
Covidien began its dividend history by paying $0.16 towards the end of 2007. It then paid $0.16 per quarter all four quarters of calendar year 2008, totaling $0.64 in dividends per share for that year. In calendar year 2009, the company paid $0.16 per quarter for each of the first three quarters, and then finished the year with a $0.18 payment. In calendar year 2010, the company paid $0.18 for each of the first three quarters and then finished the year with a $0.20 payment. The company ends its fiscal year in September of each year, so the quarterly payments of $0.16, $0.18, and $0.20 align with their fiscal years and result in a 12.5% and 11.1% increase respectively. Annualized, this represents 12% compounded dividend growth.
Balance Sheet
Covidien has mediocre balance sheet strength. LT Debt/Equity is an appealing 0.50, which is fairly low, but goodwill on the balance sheet nearly equals shareholder equity. The current and quick ratios are both above 1, and the interest coverage ratio is above 10, which is solid.Investment Thesis
I’m bullish on the undervalued health care industry, and Covidien is no exception for me. The health care industry is perpetually necessary, and regulation changes are keeping otherwise exceptionally strong stocks at low or mid valuation levels.Covidien’s top medical device product lines are Endomechanical Instruments ($2,139 million in 2010 sales), Energy Devices ($992 million) Soft Tissue Repair Products ($854 million), Oximetry and Monitoring Products ($755 million), Airway and Ventilation Products ($770 million), and Vascular Products ($810 million). The sales of the Vascular Products line are up 41% over 2009, and the Oximetry and Monitoring Products line and Energy Devices line both had double-digit growth as well.
The pharmaceutical segment generally experienced mild declines in sales compared to the fair growth of the medical device segment.
As per the Q4 2010 financial report, the company acquired Aspect, ev3, and Somanetics, and divested their specialty chemicals business, U.S. nuclear pharmacies, and sleep and oxygen product lines. More than 20 new products were launched in 2010.
These early years as an independent company seem to have mostly focused on product portfolio tuning and strategic streamlining, rather than focusing on short-term annual growth. Still, the company’s robust free cash flow allowed it to return value to shareholders in the form of both dividends and share repurchases. These changes have set the company up to perform well in 2011, 2012, and later, as their pipeline is strong and they’ve focused on portfolio strengths.
Risks
The healthcare industry naturally carries with it substantial risk. Litigation is an ever-present risk, as are pipeline weaknesses and products that perform worse than expected. The company also has substantial currency risk. One of Covidien’s companies, ev3, recently voluntarily recalled some of their catheters due to the potential of breakage. In heath care, quality control is of particular importance.Conclusion and Valuation
In conclusion, I find Covidien to be a reasonably attractive investment at these prices. It’s not much of a dividend stock, but with EPS and dividend growth could make for substantial gains in the long term.2010 EPS was $3.24, and analysts predict EPS to be $3.57 and $3.94 in 2011 and 2012 respectively. Analyst accuracy can vary wildly, but assuming these numbers are reasonably accurate, that translates into compounded EPS growth of a bit over 10%. With a P/E of over 15, this results in a forward PEG ratio of well over 1. Even if the dividend yield is added to the growth value, the PEG ratio is still over 1. Admittedly, the PEG ratio is less than useful when companies experience low growth, and only moderately useful when companies experience moderate growth like Covidien, but it serves as a useful check.
If interested in the stock, it might be worth adding to a watch list to look for potential stock price dips to enter at a better price. I don’t find the stock to be overvalued by any stretch, but one always appreciates a margin of safety.
Full Disclosure:
As of this writing, I have no position in COV.
You can see my full list of individual holdings here.