

Traditional TV, you might think, is a relic of the past, a product that has passed its "best before" date.
Nexstar Media Group Inc. (NXST, Financial), the biggest owner of U.S. local television stations, could prove you wrong.
As a quality company with a fair valuation, it deserves a closer look.
About Nexstar
Formed in 1996 and headquartered in Irving, TX, the company calls itself the country’s biggest local television and media company. On its website, it also offered the following stats:
- 199 full-power television stations (including partner stations).
- Operating in 116 markets that reach more than 68% of U.S. television households.
- To these stations and markets, the company provides what it calls “exceptional local content and network programming to inform and entertain viewers, while providing premium, scalable local advertising opportunities for advertisers and brands across all screens and devices.”
The big story, for investors, is about an exceptional acquisition machine that has gobbled up individual stations and groups, with all of them apparently providing accretive revenue and earnings. The following slide comes from its January 2022 investor presentation:

Also from the presentation, five near and long-term, organic growth drivers:
- Increasing fees for retransmission (what content providers pay to television stations).
- Surging political spending, thanks in part to an increasingly polarized political environment. The company reports, “Nexstar historically gets 12 – 15% of the gross U.S. broadcast television political spend.”
- The development of new advertising categories, such as sports betting.
- Digital advertising fees; the company has had 98 million unique visitors monthly.
- Monetizing its underlying spectrum, through what it calls NEXTGEN TV.
Competition
According to the 10-K, competition occurs at three distinct levels:
- Audience: Refers to the competition for audience share and that is based on program popularity.
- Programming: The race to negotiate, with national program distributors or syndicators, to buy the rights to broadcast popular programs.
- Advertising: Revenue from advertising sales, and that involves competing not just with other television stations, but with all manner of media, including online operators such as Google (GOOG, Financial)(GOOGL, Financial).
GuruFocus lists Tegna Inc. (TGNA, Financial) and AMC Networks Inc. (AMCX, Financial) as its main competitors.
In its investor presentation, it argues that it possesses several competitive advantages: scale, well positioned assets, valuable local news content and an accretive merger and acquisitions strategy.
Risks
In addition to the conventional market and financial risks, Nexstar also faces underfunded pension plans.
First, its qualified non-contributory defined benefit retirement plans had $2.22 billion in assets to pay benefits (at Dec. 31, 2020), but the fund was still underfunded by $274 million. That year, the company had to contribute $40.5 million to the Tribune Media Company’s pension plans (Nexstar acquired Tribune in 2019).
Its non-contributory, unfunded supplemental executive retirement and ERISA excess plans had a total liability of $57.7 million.
The company has frozen participation and benefits under all plans, because significant declines in stock market returns and lower discount rates could force the company to make even more cash contributions.
Financial strength

As the table makes clear, Nexstar receives a low grade for its financial strength, and the debt lines at the top of the table show us why.
Here’s a chart showing the growing debt level:

However, the chart does not show how assets have grown along with the debt. As the following chart illustrates, the base upon which the company increases its revenue and earnings has also grown at an accelerated rate:

The growth of assets has also produced growth in free cash flow:

A couple of other items to note in this table: The company receives a high Piotroski F-Score, indicating management is doing a good job. Second, the slight difference between the return on invested capital of 8% and the average cost of that capital of 7.39%.
Profitability

The profitability rank tells us Nexstar is a powerful generator of margins, returns and growth. The dark green bars indicate it is much better in several areas than its competitors and peers in the media – diversified industry. The lighter green bars indicate a better than average performance. Overall, the company is an outperformer on all key measures.
Looking more closely at the growth lines, we observe that Nexstar’s Ebitda has grown by an average of 32.30% per year over the past three years, while the average industry growth has been just 0.75%.
Performance
That asset growth and profitability have driven the company’s performance to heights well above those of its competitors:

(1.7k% refers to the 1,694.28% growth over the decade, as shown in the top right corner.)
Long-term investors have had to live through some bumpy years to get the big returns:

Despite the volatility, Nexstar receives a full five out of five stars score for the predictability of its returns.
Dividend

The dividend yield is in the same ballpark as the S&P 500 average at 1.74. However, the rising share price has overshadowed the strength of the yield.
The dividend payout ratio is low, while the dividend growth rate is high. When there is another dip in the share price, investors may have an opportunity to lock into a good dividend in a growth stock. Even at the current price, the five-year yield-on-cost comes in at 5.19%.
Shares
Nexstar used share issuances, as well as debt, to fund its acquisitions and, as a result, the share count rapidly escalated a few years ago. Since then, the company has begun trimming the numbers:

The chart shows the insiders’ holdings, with the three largest tranches belonging to CEO Perry A. Sook, President and Chief Operating Officer Thomas E. Carter and Timothy C. Busch, the president of subsidiary Nexstar Broadcasting.

Valuation
This is a 10-year price chart for Nexstar:

Although the share price has grown quickly, the company still receives a high score for valuation:

Nexstar has a price-earnings ratio of less than half that of the industry median of 7.41 versus 19.05, hence the dark green line. Its ratio is better than 81.69% of its peers and competitors.
That along with a high Ebitda growth rate over the past five years of 26.90% gives the company a low PEG ratio of just 0.28, compared to the fair value mark of 1.00.
Using the default settings of the discounted cash flow calculator, we arrive at a conclusion of undervalued. Note that the default assigns a 10-year growth rate of only 5%, which seems overly conservative:

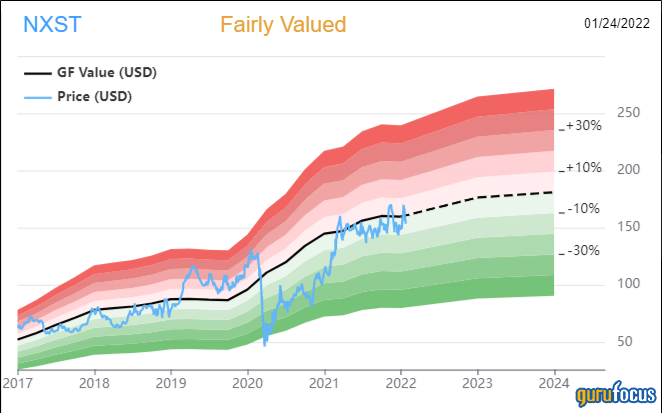
The GF Value Line arrives at a fair valuation:
Gurus
The investing gurus have bought more than they have sold over the past four quarters:

Ten gurus held positions in Nexstar at the end of September, and the largest positions belonged to:
- Seth Klarman (Trades, Portfolio) of The Baupost Group, who had the biggest stake by far at 2,046,000 shares. That represented 5% of Nexstar’s capital and 2.86% of the fund’s holdings.
- Mario Gabelli (Trades, Portfolio) of GAMCO Investors. He added nearly 16% during the quarter to bring his share count up to 125,142 shares.
- Keeley-Teton Advisors, LLC (Trades, Portfolio), which reduced its holding by 9.05% to 101,656 shares.
Conclusion
Nexstar Media Group has used its acquisition expertise and strong management to grow a traditional company like a technology company. It increased its debt, but has grown its total assets even faster, meaning rapid growth in Ebitda and earnings per share.
At the same time, its valuation is reasonable, most likely undervalued, thanks to a recent dip. At the same time, it is growing its dividend quickly; within five years this stock could provide decent capital gains and income at the same time.
Value investors might like the valuation but shy away because of the debt levels. Growth investors may see an opportunity now, but income investors should wait a few years.