The U.S. and China stock markets started February less overvalued compared to the start of the New Year according to Berkshire Hathaway Inc. (BRK.A, Financial)(BRK.B, Financial) CEO Warren Buffett (Trades, Portfolio)’s favorite market indicator.
On Tuesday, the ratio of the Wilshire 5000 full cap price index to the sum of gross domestic product and the total assets of the Federal Reserve stood at 139.5%, down from the all-time high of approximately 150%.

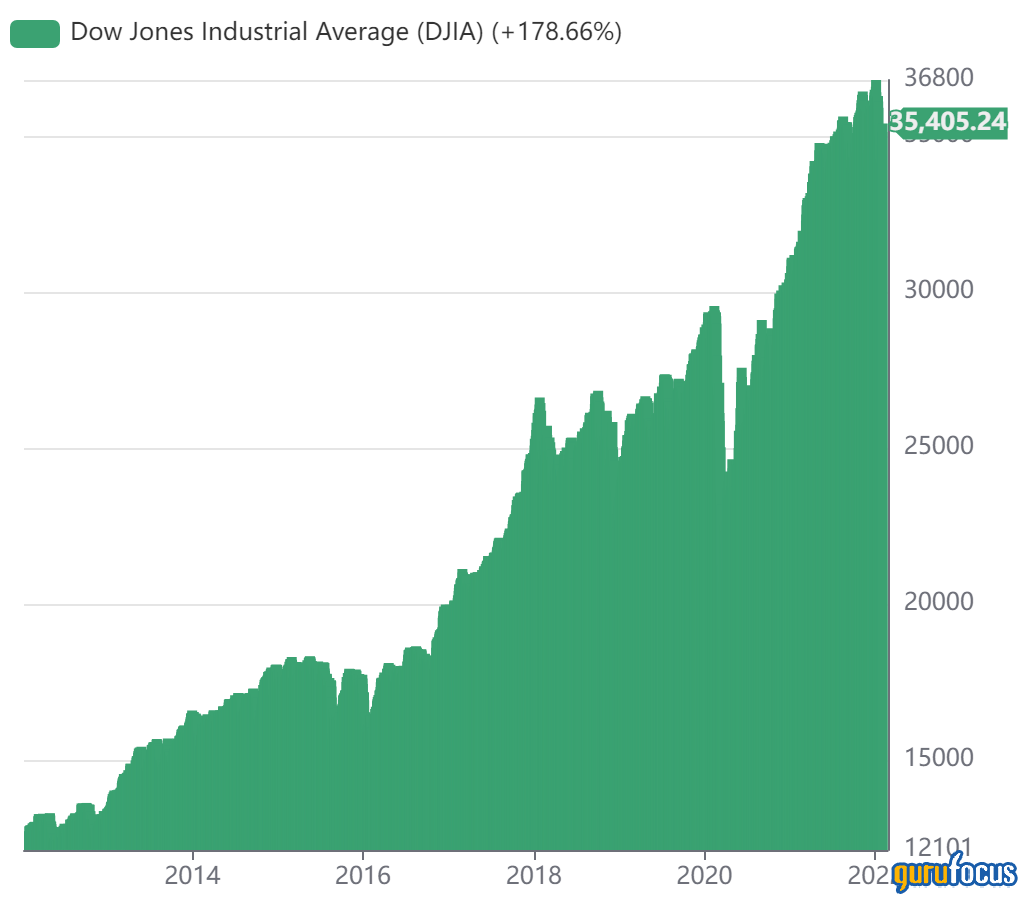
Dow continues rebound from January low
The Dow Jones Industrial Average closed at 35,629.33, up 224.09 points from Tuesday’s close of 35,405.24 and 1,468.55 points from last Thursday’s close of 34,160.78.
U.S. stock indexes climbed on the back of strong earnings from Big Tech companies like Google parent Alphabet Inc. (GOOGL, Financial)(GOOG, Financial) and consumer electronics giant Apple Inc. (AAPL, Financial). Shares of Alphabet and Apple gained approximately 13% and 7% over the past five days.

The U.S. market is coming off a volatile month of January: According to Aggregated Statistics charts, a Premium feature of GuruFocus, the mean one-month total return of the Dow 30 stocks is -1.19% with a median of -1.73%.

For the stocks in the Standard & Poor’s 500 index, the mean one-month total return is -3.77% with a median of -4.22%.

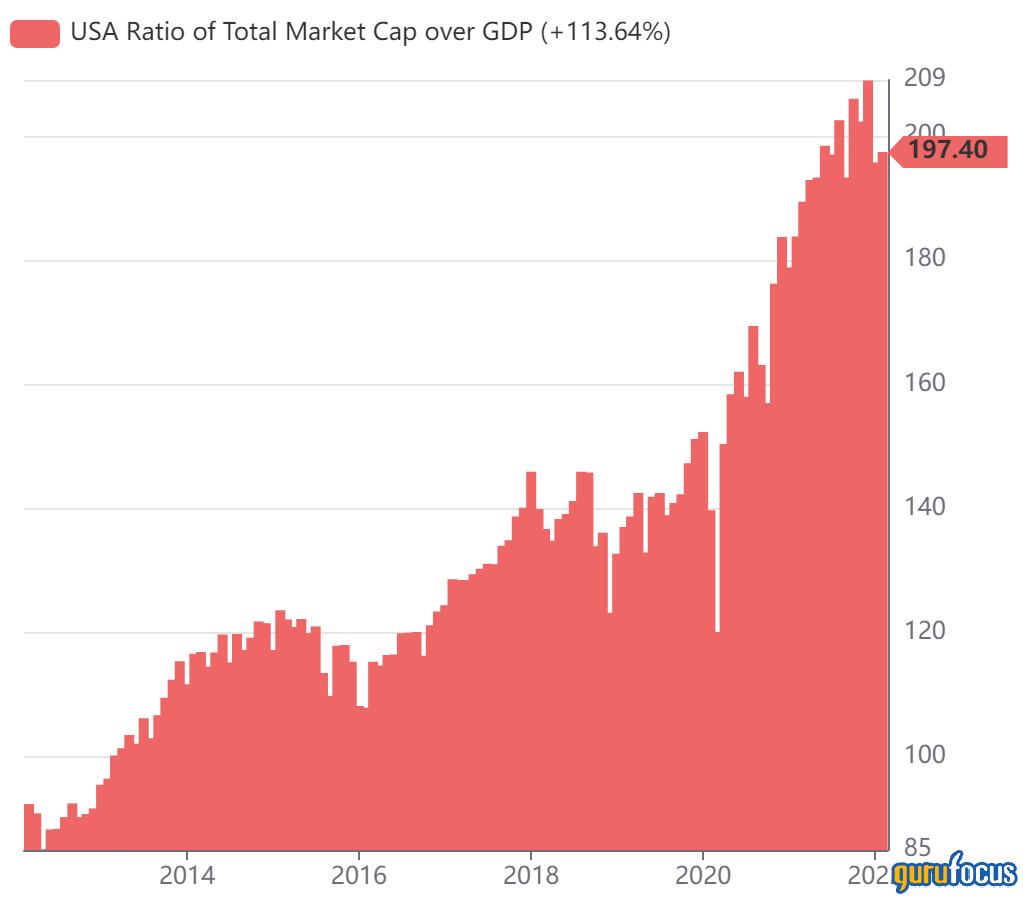
Buffett Indicator retreats from all-time high
According to Buffett, the ratio of total market cap to gross domestic product is “probably the best single measure of where valuations stand at any given moment.” Based on the current market valuation level of 139.5%, the U.S. market is expected to return approximately 0.2% per year on average over the next eight years assuming a reversion to the 20-year median level of 92.49%.
The Predicted and Actual Returns chart considers a pessimistic case of reversion to 70% of the 20-year-median level and an optimistic case of reversion to 130% of the 20-year-median level. Based on the chart, the expected market return per year ranges from -4% to 1.5%.
China market becomes fairly valued
GuruFocus’ Global Market Valuation pages applies Buffett’s market indicator concept to over 20 countries around the globe, including European and Asian countries.

The Chinese stock market is fairly valued based on its current market valuation ratio of 43.25%, compared to the 10-year low of 24.88% and the 10-year high of 60.34%. Based on the current market valuation level, the implied market return of the Chinese stock market is approximately 6.1%.

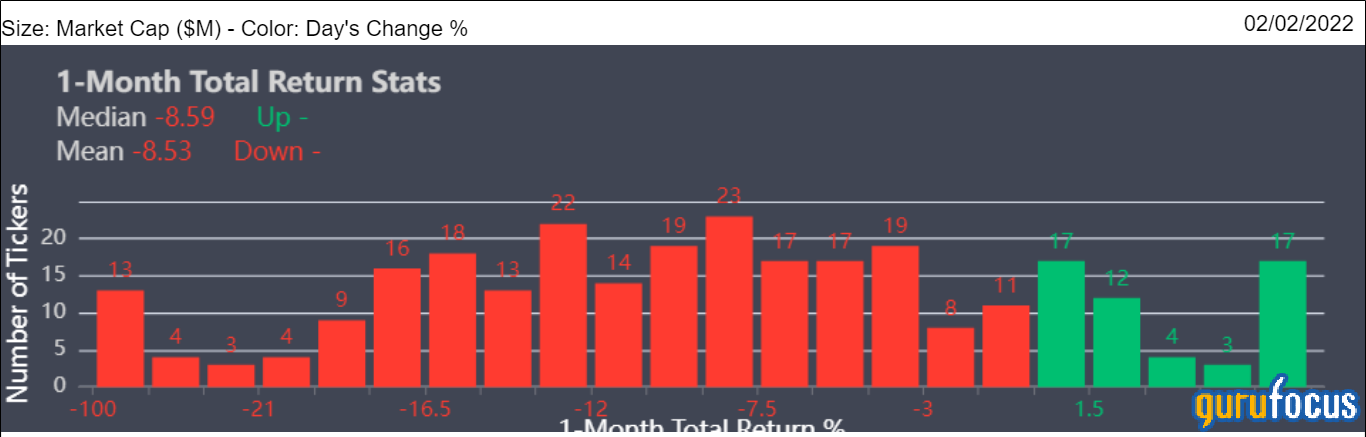
According to the Aggregated Statistics Chart, the mean one-month total return of the CSI 300 stocks is -8.53% with a median of -8.59%.