
SoFi Technologies, Inc. (NASDAQ: SOFI), a member-centric, one-stop shop for digital financial services that helps members borrow, save, spend, invest and protect their money, reported financial results today for its second quarter ended June 30, 2023.
This press release features multimedia. View the full release here: https://www.businesswire.com/news/home/20230731284667/en/
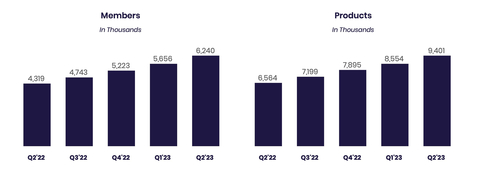
Members (In Thousands), Products (In Thousands) (Graphic: Business Wire)
“We delivered another quarter of record financial results and generated our ninth consecutive quarter of record adjusted net revenue, which was up 37% year-over-year. Record revenue at the company level was driven by record revenue in both our Technology Platform business segment and our Financial Services business segment coupled with continued strong Lending business segment revenue growth. We also generated our fourth consecutive quarter of record adjusted EBITDA of $77 million, representing a 43% incremental adjusted EBITDA margin and a 16% margin overall, as well as a 36% incremental GAAP net income margin,” said Anthony Noto, CEO of SoFi Technologies, Inc.
Consolidated Results Summary | |||||||||||
| Three Months Ended June 30, | ||||||||||
($ in thousands, except per share amounts) | 2023 | 2022 | % Change | ||||||||
Consolidated – GAAP | |||||||||||
Total net revenue | $ | 498,018 | $ | 362,527 | 37 | % | |||||
Net loss | (47,549 | ) | (95,835 | ) | (50 | )% | |||||
Net loss attributable to common stockholders – basic and diluted(1) | (57,628 | ) | (105,914 | ) | (46 | )% | |||||
Loss per share attributable to common stockholders – basic and diluted | (0.06 | ) | (0.12 | ) | (50 | )% | |||||
Consolidated – Non-GAAP | |||||||||||
Adjusted net revenue(2) | $ | 488,815 | $ | 356,091 | 37 | % | |||||
Adjusted EBITDA(2) | 76,819 | 20,304 | 278 | % | |||||||
___________________
(1) | Adjusted for the contractual amount of dividends payable to holders of Series 1 redeemable preferred stock, which are participating interests. | |
(2) | Adjusted net revenue and adjusted EBITDA are non-GAAP financial measures. For more information and reconciliations to the most comparable GAAP measures, see “Non-GAAP Financial Measures” and Table 2 to the “Financial Tables” herein. |
Noto continued: “Our record number of member additions and strong momentum in product and cross-buy adds, along with improving operating efficiency, reflects the benefits of our broad product suite and unique Financial Services Productivity Loop (FSPL) strategy. We added over 584,000 new members during the second quarter, and ended with over 6.2 million total members, up 44% year-over-year. We also added nearly 847,000 new products during the second quarter, and ended with over 9.4 million total products, a 43% annual increase.”
Noto concluded: “Total deposits grew by $2.7 billion, up 26% during the second quarter to $12.7 billion at quarter-end, and over 90% of SoFi Money deposits (inclusive of Checking and Savings and cash management accounts) are from direct deposit members. For new direct deposit accounts opened in the second quarter, the median FICO score was 747. More than half of newly funded SoFi Money accounts are setting up direct deposit by day 30, and this has had a significant impact on debit spending, with continued strong cross-buy trends from this attractive member base into Lending and other Financial Services products. With our launch of offering FDIC insurance of up to $2 million, nearly 98% of our deposits were insured at quarter end.
As a result of this growth in high quality deposits, we have benefited from a lower cost of funding for our loans. Our deposit funding also increases our flexibility to capture additional net interest margin (NIM) and optimize returns, a critical advantage in light of notable macro uncertainty. SoFi Bank, N.A. generated $63.1 million of GAAP net income at a 17% margin.”
Consolidated Results
Second quarter total GAAP net revenue increased 37% to $498.0 million from the prior-year period's $362.5 million. Second quarter adjusted net revenue of $488.8 million was up 37% from the same prior-year period's $356.1 million. Second quarter record adjusted EBITDA of $76.8 million increased 278% from the same prior year period's $20.3 million.
SoFi hit a number of key financial inflection points in the quarter, including adjusted EBITDA exceeding share-based compensation expense of $75.9 million for the second consecutive quarter. Additionally, SoFi improved contribution loss in the Financial Services segment to $4 million versus $24 million in the first quarter of 2023 and $54 million in the second quarter of 2022. The improvement in the Financial Services business segment contribution loss reinforces the company’s confidence in achieving positive contribution profit in all three business segments by year end, as well as overall GAAP profitability for the company for the fourth quarter of 2023. SoFi recorded a GAAP net loss of $47.5 million for the second quarter of 2023, an improvement from the prior-year period's net loss of $95.8 million.
Member and Product Growth
SoFi achieved strong year-over-year growth in both members and products in the second quarter of 2023. Record new member additions of over 584,000 brought total members to over 6.2 million by quarter-end, up over 1.9 million, or 44%, from the end of 2022's second quarter.
New product additions of nearly 847,000 in the second quarter brought total products to over 9.4 million at quarter-end, up 43% from 6.6 million at the same prior year quarter-end.
In the Financial Services segment, total products increased by 47% year-over-year, to 7.9 million from 5.4 million in the second quarter of 2022. SoFi Money (inclusive of Checking and Savings and cash management accounts) grew 47% year-over-year to 2.7 million products, SoFi Invest grew 18% year-over-year to 2.3 million products, and SoFi Relay grew 90% year-over-year to 2.6 million products.
Lending products increased 25% year-over-year to 1.5 million products, driven primarily by continued record growth in personal loans.
Technology Platform enabled accounts increased by 11% year-over-year to 129.4 million.
Lending Segment Results
Lending segment GAAP and adjusted net revenues were $331.4 million and $322.2 million, respectively, for the second quarter of 2023, both up 29% compared to the second quarter of 2022. Higher loan balances and net interest margin expansion drove strong growth in net interest income.
Lending segment second quarter contribution profit of $183.3 million increased 29% from $142.0 million in the same prior-year period. Contribution margin using Lending adjusted net revenue remained healthy at 57% in both the second quarter of 2023 and the same prior-year period. These advances reflect SoFi’s ability to capitalize on continued strong demand for its lending products.
Lending – Segment Results of Operations | |||||||||||
Three Months Ended June 30, | |||||||||||
($ in thousands) | 2023 | 2022 | % Change | ||||||||
Net interest income | $ | 231,885 | $ | 114,003 | 103 | % | |||||
Noninterest income | 99,556 | 143,114 | (30 | )% | |||||||
Total net revenue – Lending | 331,441 | 257,117 | 29 | % | |||||||
Servicing rights – change in valuation inputs or assumptions | (8,601 | ) | (9,098 | ) | (5 | )% | |||||
Residual interests classified as debt – change in valuation inputs or assumptions | (602 | ) | 2,662 | n/m | |||||||
Directly attributable expenses | (138,929 | ) | (108,690 | ) | 28 | % | |||||
Contribution Profit | $ | 183,309 | $ | 141,991 | 29 | % | |||||
Adjusted net revenue – Lending(1) | $ | 322,238 | $ | 250,681 | 29 | % | |||||
___________________
(1) | Adjusted net revenue – Lending represents a non-GAAP financial measure. For more information and a reconciliation to the most comparable GAAP measure, see “Non-GAAP Financial Measures” and Table 2 to the “Financial Tables” herein. |
Lending – Loans Held for Sale | |||||||||||||
| Personal Loans | Student Loans | Home Loans | Total | |||||||||
June 30, 2023 | |||||||||||||
Unpaid principal | $ | 12,171,935 | $ | 5,262,975 | $ | 87,928 | $ | 17,522,838 | |||||
Accumulated interest | 82,868 | 21,164 | 150 | 104,182 | |||||||||
Cumulative fair value adjustments(1) | 496,360 | 99,782 | (9,495 | ) | 586,647 | ||||||||
Total fair value of loans(2) | $ | 12,751,163 | $ | 5,383,921 | $ | 78,583 | $ | 18,213,667 | |||||
March 31, 2023 | |||||||||||||
Unpaid principal | $ | 10,039,769 | $ | 5,086,953 | $ | 89,782 | $ | 15,216,504 | |||||
Accumulated interest | 69,049 | 20,787 | 162 | 89,998 | |||||||||
Cumulative fair value adjustments(1) | 428,181 | 132,319 | (8,897 | ) | 551,603 | ||||||||
Total fair value of loans(2) | $ | 10,536,999 | $ | 5,240,059 | $ | 81,047 | $ | 15,858,105 | |||||
___________________
(1) | The cumulative fair value adjustments for personal loans during the three months ended June 30, 2023 were primarily impacted by higher origination volume, partially offset by lower fair value marks driven primarily by a higher discount rate, while the cumulative fair value adjustments for student loans were primarily impacted by a higher weighted average discount rate and higher prepayment rate assumption, which also resulted in lower fair value marks. | |
(2) | Each component of the fair value of loans is impacted by charge-offs during the period. Our fair value assumption for annual default rate incorporates fair value markdowns on loans beginning when they are 10 days or more delinquent, with additional markdowns at 30, 60 and 90 days past due. |
The following table summarizes the significant inputs to the fair value model for personal and student loans:
Personal Loans | Student Loans | |||||||||||
June 30, 2023 | March 31, 2023 | June 30, 2023 | March 31, 2023 | |||||||||
Weighted average coupon rate(1) | 13.6 | % | 13.2 | % | 5.0 | % | 4.9 | % | ||||
Weighted average annual default rate | 4.6 | 4.6 | 0.5 | 0.4 | ||||||||
Weighted average conditional prepayment rate | 19.0 | 19.1 | 10.6 | 10.4 | ||||||||
Weighted average discount rate | 6.1 | 5.5 | 4.4 | 4.1 | ||||||||
___________________
(1) | Represents the average coupon rate on loans held on balance sheet, weighted by unpaid principal balance outstanding at the balance sheet date. |
Second quarter Lending segment total origination volume increased 37% year-over-year, as a result of continued strong demand for personal loans.
Record personal loan originations of over $3.7 billion in the second quarter of 2023 were up $1.3 billion, or 51%, year-over-year, and rose 27% sequentially. This strong performance was aided by years of investment in technology to automate and accelerate the application-to-approval process for qualified borrowers and constant testing of risk controls and underwriting models to maintain high credit quality and strong returns. Second quarter student loan volume of over $395 million continued to reflect the uncertainty around federal student loan payments. Second quarter home loan volume of over $243 million was down 27% year-over-year, but nearly tripled sequentially, as we began to benefit from the technology platform and overall loan capacity from our acquisition at the beginning of the quarter.
Lending – Originations and Average Balances | |||||||||
Three Months Ended June 30, | |||||||||
2023 | 2022 | % Change | |||||||
Origination volume ($ in thousands, during period) | |||||||||
Personal loans | $ | 3,740,981 | $ | 2,471,849 | 51 | % | |||
Student loans | 395,367 | 398,722 | (1 | )% | |||||
Home loans | 243,123 | 332,047 | (27 | )% | |||||
Total | $ | 4,379,471 | $ | 3,202,618 | 37 | % | |||
Average loan balance ($, as of period end)(1) | |||||||||
Personal loans | $ | 23,767 | $ | 24,421 | (3 | )% | |||
Student loans | 45,523 | 48,474 | (6 | )% | |||||
Home loans | 277,077 | 287,205 | (4 | )% | |||||
_________________
(1) | Within each loan product category, average loan balance is defined as the total unpaid principal balance of the loans divided by the number of loans that have a balance greater than zero dollars as of the reporting date. Average loan balance includes loans on the balance sheet and transferred loans with which SoFi has a continuing involvement through its servicing agreements. |
Lending – Products | June 30, | ||||||
2023 | 2022 | % Change | |||||
Personal loans | 985,396 | 714,735 | 38 | % | |||
Student loans | 491,499 | 462,164 | 6 | % | |||
Home loans | 26,997 | 25,128 | 7 | % | |||
Total lending products | 1,503,892 | 1,202,027 | 25 | % | |||
Technology Platform Segment Results
Technology Platform segment record net revenue of $87.6 million for the second quarter of 2023 increased 4% year-over-year and 13% sequentially, and includes strong contribution from Galileo, which had 9% sequential revenue growth, and continued strong contribution from Technisys, which had 21% sequential revenue growth. Contribution profit of $17.2 million decreased 21% year-over-year, for a margin of 20%, which improved modestly from the prior quarter. We are seeing strong adoption of new products, including Konecta, our AI natural language customer service bot, and our Payments Risk Platform (PRP), a platform which leverages transactional data to reduce transaction fraud.
Technology Platform – Segment Results of Operations | |||||||||||
| Three Months Ended June 30, | ||||||||||
($ in thousands) | |||||||||||