
PR Newswire
VANCOUVER, BC, July 31, 2023
TSX: SIL | NYSE American: SILV
VANCOUVER, BC, July 31, 2023 /PRNewswire/ - SilverCrest Metals Inc. ("SilverCrest" or the "Company") is pleased to announce the results from an Updated Independent Technical Report (the "Report") for the Las Chispas Operation ("Las Chispas" or the "Operation") in Sonora, Mexico prepared by Ausenco Engineering Canada Inc. ("Ausenco") with the assistance of several other independent engineering companies and consultants. The Report will be filed on SEDAR+ within 45 days of the date of this news release. All amounts herein are presented in United States Dollars ("US$"), unless otherwise stated.
The effective date of the Measured and Indicated ("M&I") Mineral Resource and Mineral Reserve Estimate is June 30, 2022. The financial model and Life of Mine ("LOM") production plan, factoring in the processed and depleted ore up to December 31, 2022, starts on January 1, 2023. The results announced in this news release are compared to those disclosed in a prior technical report dated January 4, 2021 (the "2021 Feasibility Study" or "2021 FS") filed on SEDAR February 2, 2021 titled "NI 43-101 Technical Report & Feasibility Study on The Las Chispas Project". In this Report, silver equivalent ("AgEq") references are based on an updated silver ("Ag") to gold ("Au") ratio of 79.51:1 (formerly 86.9:1 in the 2021 FS). The 2021 Feasibility Study is no longer current, the 2021 Feasibility Study results are no longer supported by the results in the Report and should not be relied upon.
Updated Technical Report Highlights
- Robust Production Profile with Strong NPV of $549.9M at Base Case - The Report has confirmed strong economics for an eight-year operation generating average annual production of 57 thousand ("k") ounces ("oz")/year Au and 5.5 million ("M") oz/year Ag (10.0 Moz/year AgEq) during the first seven full years. Using a 5% discount rate and average gold and silver prices of $1,800/oz and $23.00/oz respectively as the Base Case, Las Chispas generates a post-tax net present value ("NPV (5%)") of $549.9M.
- Strong Cash Flows, Debt Free, Healthy Balance Sheet - The Operation is estimated to generate average annual post-tax free cash flow of approximately $84.3M from 2023 to 2029 at the Base Case. SilverCrest has paid off 100% of its $90M debt since commercial production was announced in November 2022 and at the end of Q2, 2023 had accumulated a treasury assets1 balance of $59.0M.
- Report Details Supported by Current Operational Performance - The Report is based on actual operating data from the mine and process plant, including cost models supported by actual operating costs, completion of more than 16 kilometres ("km") of underground development (January 2021 to December 2022) and recovered metal of 17.8 koz Au and 1.74 Moz Ag (3.2 Moz AgEq) since process plant startup in early June 2022 until the end of 2022.
- Updated Mineral Reserve Estimate - The updated Proven and Probable Mineral Reserve Estimate of 78.6 Moz AgEq (3.4 Mt grading 4.08 gpt Au and 395 gpt Ag, or 719 gpt AgEq) is a 13% reduction in AgEg ounces from the 2021 FS. This reduction incorporates the updated gold to silver ratio, updated modelling for narrower and more widely dispersed veins than originally modelled, increase in cut-off grades due to increased industry costs, revised geotechnical standards, and mining method changes.
- Simplified Underground Production Plan - The updated production plan reaches slightly above 1,200 tonnes per day ("tpd") in 2026 and is largely supported by long-hole stoping (77%) with the balance being cut and fill (17%), and resue (6%). This approach significantly simplifies the mine plan through the reduction of working faces, equipment and labour, while also addressing safety and productivity issues. The use of this bulk mining method, when combined with narrower veins, has led to a reduction in LOM mined grade of approximately 18%.
- Metallurgical Recoveries Improved - The Report is based on actual achieved process plant metallurgical recoveries of an estimated 98.0% Au and 97.0% Ag, both improved from the recoveries of 97.6% Au and 94.3% Ag estimated in the 2021 FS.
- Higher Sustaining Capital Reflects Increased Costs and Expanded Mine Footprint - LOM sustaining capital of $219.9M has increased by 77.5% compared to the 2021 FS as development unit costs and the amount of infrastructure required increased due to the expanded mine footprint.
- Lowest Quartile2 AISC Remains - The Report estimates all-in sustaining costs3 ("AISC") to average $11.98/AgEq payable oz over the LOM, exclusive of corporate level G&A and sustaining exploration costs. For the period of H2, 2023 through 2024, the AISC is estimated to average approximately $13.50/AgEq payable oz which is the highest cost period in the LOM due to an accelerated spend in sustaining capital to support ramp-up of mine throughput.
- Immediate and Longer-Term Growth Opportunities - Immediate growth will be targeted through a $10M exploration program focused on targeting 40% of the updated Inferred Mineral Resource (1.3 Mt grading 566 gpt AgEq or 24.1 Moz AgEq) for conversion to M&I Mineral Resources for future Mineral Reserve consideration. The focus is on higher grade Mineral Reserve replacement targets proximal to current and planned infrastructure. Earlier stage exploration opportunities at Las Chispas will be pursued in parallel.
1 Treasury assets is a Non-IFRS measure. See "Non-IFRS Measures" section below. At the end of Q2, 2023, treasury assets include cash of $53.4M and bullion purchases held at current market value of $5.6M. |
Pierre Beaudoin, COO, commented, "The results from the Report confirm our confidence in Las Chispas, which has also been demonstrated through strong operational performance since commissioning was undertaken in Q2, 2022. The Report reflects updated costs and production expectations, and although these have changed since the 2021 Feasibility Study, we view them to be executable, particularly as they are supported by recent operating experience. We thank our operations team and numerous independent consultants who advanced this work, while also simultaneously executing at the Las Chispas Operation."
N. Eric Fier, CEO stated "The release of the results from the Report is a significant milestone and the latest of a long list of de-risking events for our Company. Given the current worldwide inflationary environment and site-specific changes, our updated Mineral Resources and Reserves, production and costing estimates better reflect the current operating parameters at Las Chispas. The operational performance and cash flow generated to date at Las Chispas support the findings of the Report which outline a high margin operation that generates significant free cash flow. The recent success of the Operation has allowed us to repay all $90M of debt since commercial production was achieved in November of 2022, while also building a strong treasury assets balance of $59.0M at the end of Q2, 2023. We look forward to releasing full details of our Q2, 2023 operational and financial performance next week. We are very encouraged to now be able to refocus the Company's human and financial resources to the next phase of growth and responsible capital allocation."
Table 1 – Updated Technical Report Overview
Las Chispas Updated Technical Report Summary as of Jan. 1, 2023 | |
Average Process Plant Throughput (2023 to 2029) (tpd) | 1,200 |
Mine Life (years) | 8.0 |
Average Gold Process Plant Head Grade (gpt Au) | 4.02 |
Average Silver Process Plant Head Grade (gpt Ag) | 396.1 |
Average Silver Equivalent Process Plant Head Grade (gpt AgEq) | 716.1 |
Contained Gold in Mine Plan (koz Au) | 422.7 |
Contained Silver in Mine Plan (koz Ag) | 41,615.5 |
Contained Silver Equivalent in Mine Plan (koz AgEq) | 75,227.5 |
Average Gold Metallurgical Recovery (% Au) | 98.0 |
Average Silver Metallurgical Recovery (% Ag) | 97.0 |
Payable Gold (koz Au) | 421.6 |
Payable Silver (koz Ag) | 41,005.5 |
Payable Silver Equivalent (koz AgEq) | 74,525.4 |
Average Annual Production (2023 to 2029) | |
Gold (Au koz/yr) | 57.0 |
Silver (Ag koz/yr) | 5,503.5 |
Silver Equivalent (AgEq koz/yr) | 10,036.0 |
Mining Cost ($/t mined) | 108 |
Process Cost ($/t processed) | 47 |
G&A Cost ($/t processed) | 21 |
Total Operating Cost ($/t processed) | 168 |
LOM Sustaining Capital Cost ($M) | 219.9 |
Closure Costs ($M) (2030 to 2032) | 6.8 |
Cash Costs (1) ($/oz AgEq – Payable) LOM | 7.84 |
AISC (1) ($/oz AgEq – Payable) LOM – Mine Level | 11.98 |
Au Price ($/oz) | 1,800 |
Ag Price ($/oz) | 23.00 |
Pre-Tax NPV (5%, $M) | 706.5 |
Post-Tax NPV (5%, $M) | 549.9 |
Undiscounted LOM net free cash flow(1) ($M) | 654.1 |
LOM AISC Margin (%) | 48 % |
Notes: |
1. Cash costs, AISC and net free cash flows areNon-IFRS measures. See "Non-IFRS Measures" section below |
2. All numbers in table pertain to full LOM (2023-2030) unless otherwise stated. Numbers are rounded |
3. Reserve depleted by 3.4 MozAgEq representing ore processed from July 1, 2022 to December 31, 2022 |
4. Payable metal includes ounces sold from inventory |
5. Mine Level AISC does not include Corporate Level G&A, share-based compensation or exploration |
Mineral Resource Estimate
The Updated Mineral Resource Estimate is provided in Table 2. This estimate was completed for underground mining of in-situ vein deposits at the Babicanora and Las Chispas Areas and for surface extraction of stockpiles from historical and current operations. All drilling, surveying and assay databases were provided by SilverCrest including data up to the cut-off date of June 30, 2022 for M&I Resource Estimates and March 21, 2023 for the Inferred Mineral Resource Estimate.
The Updated Mineral Resource Estimate benefited from the improved understanding of the deposit gained through SilverCrest's 18 months of development and production mining. Incorporating this knowledge and data led to several key changes in the Company's approach to Mineral Resource modelling as discussed below.
The Mineral Resource Estimate model was updated to reflect: narrower veins located over a larger area, thus requiring increased underground development, increased constraints on geologic, statistical, and geostatistical modelling parameters resulting in reductions in resources mainly in Babicanora Main and Babicanora Norte Main veins and increased resources in the Babi Vista Vein, including the Babi Vista Splay. Additionally, there is an increase in the number of Mineral Resource veins and the veins are more widely dispersed. The Updated Inferred Mineral Resource Estimate is reduced from the 2021 FS due to conversion to M&I Mineral Resources and application of the same stricter constraints as applied to M&I Mineral Resources.
Table 2 – Mineral Resource Estimate
Area | Classification | Tonnes (k) | Au (gpt) | Ag (gpt) | AgEq (gpt) | Contained (koz) | Contained Ag (koz) | Contained AgEq (koz) |
Babicanora Area Veins | Measured | 206.6 | 13.67 | 1,289 | 2,376 | 90.8 | 8,561 | 15,779 |
Indicated | 1,726.3 | 7.09 | 658 | 1,222 | 393.6 | 36,540 | 67,832 | |
M&I | 1,932.9 | 7.79 | 726 | 1,345 | 484.3 | 45,101 | 83,611 | |
Las Chispas Area | Indicated | 441.6 | 4.22 | 552 | 888 | 60.0 | 7,835 | 12,605 |
Total Undiluted Veins | M&I | 2,374.5 | 7.13 | 693 | 1,260 | 544.3 | 52,936 | 96,216 |
Historical Stockpiles | Indicated | 151.8 | 1.14 | 112 | 203 | 5.6 | 546 | 990 |
Run of Mine ("ROM") | Measured | 168.1 | 5.56 | 428 | 869 | 30.0 | 2,311 | 4,699 |
Total (Veins + | M&I | 2,694.4 | 6.69 | 644 | 1,176 | 579.9 | 55,794 | 101,905 |
Babicanora Area Veins | Inferred | 953.5 | 4.49 | 267 | 624 | 137.5 | 8,188 | 19,123 |
Las Chispas Area | Inferred | 373.6 | 1.81 | 274 | 418 | 21.7 | 3,296 | 5,024 |
Total Undiluted Veins | Inferred | 1,327.1 | 3.73 | 269 | 566 | 159.2 | 11,484 | 24,147 |
Notes: | |
1. | The effective date for M&I Resource estimates of the veins and stockpiles was June 30, 2022, while Inferred Resource estimates for the veins was effective March 21, 2023. |
2. | Mineral Resources are not Mineral Reserves and do not have demonstrated economic viability. |
3. | The estimate of Mineral Resources may be materially affected by environmental, permitting, legal, title, taxation, socio-political, marketing, or other relevant issues. |
4. | The Inferred Mineral Resource in this estimate has a lower level of confidence than that applied to an Indicated Mineral Resource and must not be converted to a Mineral Reserve. It can be reasonably expected that the majority of the Inferred Mineral Resource could be upgraded to an Indicated Mineral Resource with continued exploration. |
5. | Mined areas as of June 30, 2022, were removed from the wireframes and block models. |
6. | AgEq is based on Ag:Au ratio of 79.51:1 calculated using $1,650/oz Au and $21/oz Ag, with average metallurgical recoveries of 97.9% Au and 96.7% Ag, and 99.9% payable for both Au and Ag. |
7. | Mineral Resources are inclusive of the Mineral Reserves. |
8. | Cut-off grade ("COG") used for vein material is 150 gpt AgEq and, for Historical stockpiles is 110 gpt AgEq. No cut-off grade was applied to the ROM stockpile as it is based on material mined. |
9. | Totals may not add due to rounding. |
Mineral Reserve Estimate
The Mineral Reserve Estimate is provided in Table 3. The estimate was completed for underground mining of in-situ vein deposits at the Babicanora and Las Chispas Areas and for surface extraction of stockpiles from historical and current operations. All drilling, surveying and assay databases were provided by SilverCrest, including data up to the cut-off date of June 30, 2022 for Measured and Indicated Mineral Resources.
Table 3 – Proven and Probable Mineral Reserve Estimate
Area | Tonnes (k) | Au (gpt) | Ag (gpt) | AgEq (gpt) | Contained Au (koz) | Contained Ag (koz) | Contained AgEq (koz) | |
Babicanora | Proven | 345 | 7.03 | 665 | 1,224 | 78 | 7,382 | 13,589 |
Babicanora | Probable | 2,334 | 3.90 | 370 | 679 | 292 | 27,734 | 50,987 |
Las Chispas | Proven | - | - | - | - | - | - | - |
Las Chispas | Probable | 401 | 3.09 | 399 | 645 | 40 | 5,152 | 8,323 |
Babicanora + Las Chispas | Proven + | 3,081 | 4.14 | 407 | 736 | 410 | 40,269 | 72,899 |
Historical Stockpile | Proven | 150 | 1.14 | 112 | 203 | 6 | 541 | 980 |
ROM Stockpile | Proven | 168 | 5.56 | 428 | 869 | 30 | 2,311 | 4,699 |
Total Stockpile | Proven | 318 | 3.47 | 279 | 555 | 36 | 2,852 | 5,679 |
Total Mineral | Proven + | 3,399 | 4.08 | 395 | 719 | 446 | 43,121 | 78,579 |
Notes: | |
1. | The effective date of the estimate is June 30, 2022. |
2. | The Mineral Reserve is estimated using the 2019 CIM Estimation of Mineral Resources & Mineral Reserves Best Practice Guidelines and 2014 CIM Definition Standards for Mineral Resources & Mineral Reserves. |
3. | The Mineral Reserve is estimated with a 372 gpt AgEq fully loaded COG for the deposit and an 85 gpt AgEq Marginal COG for development. |
4. | The Mineral Reserve is estimated using long-term prices of $1,650/oz for gold and $21.00/oz for silver. |
5. | A government gold royalty of 0.5% is included in the Mineral Reserve estimates. |
6. | Stockpile values were provided by SilverCrest and account for approximately 7% of mineral reserve ounces. |
7. | The Mineral Reserve is estimated with a maximum mining recovery of 95%, with reductions in select areas based on geotechnical guidelines. |
8. | The Mineral Reserve presented includes both internal and external dilution. The external dilution includes a mining dilution of 0.5 m width on both the hanging wall and footwall for the long hole mining method (1 m total), and a 0.2 m width on both the hanging wall and footwall for the resue mining methods (0.4 m total). Cut-and-fill mining was assumed as breasting in all cases, using the ore sill drive width of 3.3 m as a minimum mining width inclusive of dilution. Additional external dilution was applied in select areas based on geotechnical recommendations. Backfill dilution is also included and represents 4% for the long hole mining method and 7% for cut-and-fill and resue mining methods. |
9. | A minimum mining width of 1.5 m, 3.3 m and 0.5 m was used for the long-hole, cut-and-fill and resue mining methods, respectively. |
10. | Average metallurgical recoveries applied are 97.9% Au and 96.7% Ag. |
11. | The economic viability of the Mineral Reserve has been demonstrated. |
12. | AgEq(gpt) = (Au(gpt) * 79.51 + Ag(gpt)). AgEq calculations consider metal prices, metallurgical recoveries, Mexican Government gold royalty and tax rate. |
13. | Estimates use metric units (metres (m), tonnes (t), and gpt). Metal contents are presented in troy ounces (metric tonne x grade / 31.103475). |
14. | The independent Qualified Person is not aware of any known environmental, permitting, legal, title-related, taxation, socio-political or marketing issues, or any other relevant issue that could materially affect the Mineral Reserve Estimate. |
15. | Totals may not add due to rounding. |
The Mineral Reserve has a 48 kt increase and a 12.3 Moz AgEq (13%) decrease between the 2021 FS and 2023 Mineral Reserve Estimates as shown in Table 4. It should be noted that when comparing Mineral Reserve Estimates to the 2021 FS, the reduction in AgEq oz incorporates the updated gold to silver ratio change (-3.8M AgEq ozs) as noted in Table 4. Also, the reduction incorporates; updated resource modelling for narrower and more widely dispersed veins than originally modelled, an increase in cut-off grades due to increased industry costs, revised geotechnical standards, and mining method changes. Despite the reduction in ounces, the operational data allows for increased confidence on a go-forward basis.
Table 4 – Mineral Reserve Variance
Mineral Reserve Estimate | Tonnes (k) | Au (gpt) | Ag (gpt) | AgEq (gpt) | Contained Au (koz) | Contained Ag (koz) | Contained AgEq (koz) |
2021 FS at 86.9 AgEq | 3,351 | 4.81 | 461 | 879 | 518 | 49,679 | 94,704 |
2021 FS at 79.51 AgEq | 3,351 | 4.81 | 461 | 843 | 518 | 49,679 | 90,875 |
2023 TR (June 30, 2022) | 3,399 | 4.08 | 395 | 719 | 446 | 43,121 | 78,579 |
Difference | 48 | (0.73) | (66) | (124) | (72) | (6,558) | (12,296) |
Note: The 2021 FS is no longer current and the 2021 FS results are no longer supported by the results of the 2023 Mineral Reserve Estimates in the Report and should not be relied upon. |
The processed and depleted ore, from July 1, 2022 to December 31, 2022 was deducted from the Mineral Reserve in the LOM financial model.
Reconciliation
The Company implemented a Mineral Reserve to plant global reconciliation program when the plant began operations in June 2022. The Updated Reserve Estimate was compared to actual plant production from June 2022 to April 2023 which reconciled to within 5% of the 6.8 Moz AgEq ounces processed. The reconciliation results indicate the Mineral Reserve Estimate is well represented and is within an acceptable range for a narrow and high-grade vein deposit. Using this 10-month period from the effective date of the Mineral Reserve Estimate to test the assumptions in the model alongside actual mine and plant production has further de-risked Las Chispas.
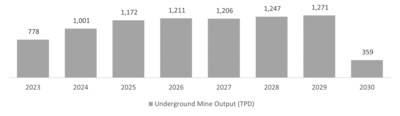
Underground Mine
The Report outlines a ramp-up as per Figure 1. For 2023, the Report estimates an average underground mine production of 778 tpd, in line with current operational performance and expectations. The mining rate will start increasing in Q1, 2024 and is expected to average approximately 1,000 tpd throughout 2024. Starting in 2026, the mining rate is expected to reach above 1,200 tpd. This rate is expected to be maintained through to 2029. This new design allows for a more conservative use of the surface stockpiles that supplement ore mined from the underground. The balance of the Las Chispas current Mineral Reserve is expected to be exhausted in 2030, during which time mining rates are expected to reduce considerably as production areas are depleted.
Learning from 18 months of ramp up production has helped to simplify the mine plan to a safer and more sustainable operation by reducing cut & fill and resue mining methods and relying more on the long-hole mining method as shown in Figure 2.
Figure 2 – Change in Percentage of Mining Methods
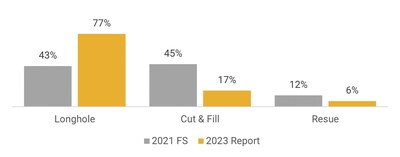
As previously disclosed in November 2022, SilverCrest's current operational plan reduced the use of the resue mining method. This method was originally incorporated to limit dilution, however, safety and productivity issues resulted in diminished operational and economic performance. The new LOM significantly reduces the use of resue mining and will be primarily replaced by the lower cost and more productive long-hole mining method. The trade-off is increased dilution which can be seen by the lower head grade. The balance of stoping production will use the cut and fill mining method in areas of poor ground conditions.
The impact of the new LOM is a less complex operation with fewer working faces, less equipment and labour, increased productivity and a reduction in per tonne mining costs. The trade-off is more dilution and a related reduction in head grade.
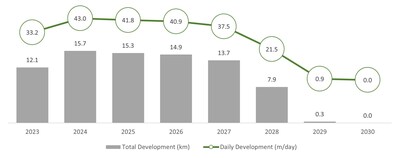
The mining schedule incorporates development rates of 34 m/day in H2, 2023, a level that is similar to Q2, 2023 performance. In 2024, the development rate is expected to increase to approximately 43 m/day. This increased development rate will be possible with the recent establishment of a third portal at the Las Chispas Area.
Figure 3 – Lateral Development Rate
Process Plant
The Las Chispas process plant has been designed to achieve nominal throughput of 1,250 tpd. The operating results to date indicate that this throughput rate can be achieved with better than initially expected metallurgical recoveries. The Report includes updated and improved recoveries of 98.0% Au and 97.0% Ag over the LOM. The simplified plant process diagram has now stopped the use of the flotation circuit which was determined to be unnecessary to achieve the improved recoveries. The process plant performance to date has also provided confidence that it can efficiently operate with a wide range of grade and clay content. The process plant is expected to operate at an average throughput of 1,200 tpd from 2023 – 2029.
Figure 4– Process Plant Throughput and Stockpile Balance at End of Period
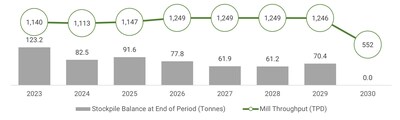
Table 5 – AgEq Mill Head Grade (gpt)
2023 | 2024 | 2025 | 2026 | 2027 | 2028 | 2029 | 2030 |
761.1 | 750.6 | 734.8 | 708.5 | 649.4 | 706.1 | 766.6 | 591.5 |