

Exploring the Dividend Performance and Sustainability of Blackrock Floating Rate Inc Stra Fd Inc (FRA, Financial)
Blackrock Floating Rate Inc Stra Fd Inc (FRA), a diversified closed-end management investment company based in the United States, recently announced a dividend of $0.12 per share, payable on 2023-10-31, with the ex-dividend date set for 2023-10-13. As investors look forward to this upcoming payment, the spotlight also shines on the company's dividend history, yield, and growth rates. Using the data from GuruFocus, let's delve into Blackrock Floating Rate Inc Stra Fd Inc's dividend performance and assess its sustainability.
What Does Blackrock Floating Rate Inc Stra Fd Inc Do?
Blackrock Floating Rate Inc Stra Fd Inc is committed to providing its shareholders with high current income and preservation of capital. The company achieves this through investment in a diversified, leveraged portfolio consisting of floating-rate debt securities and instruments.

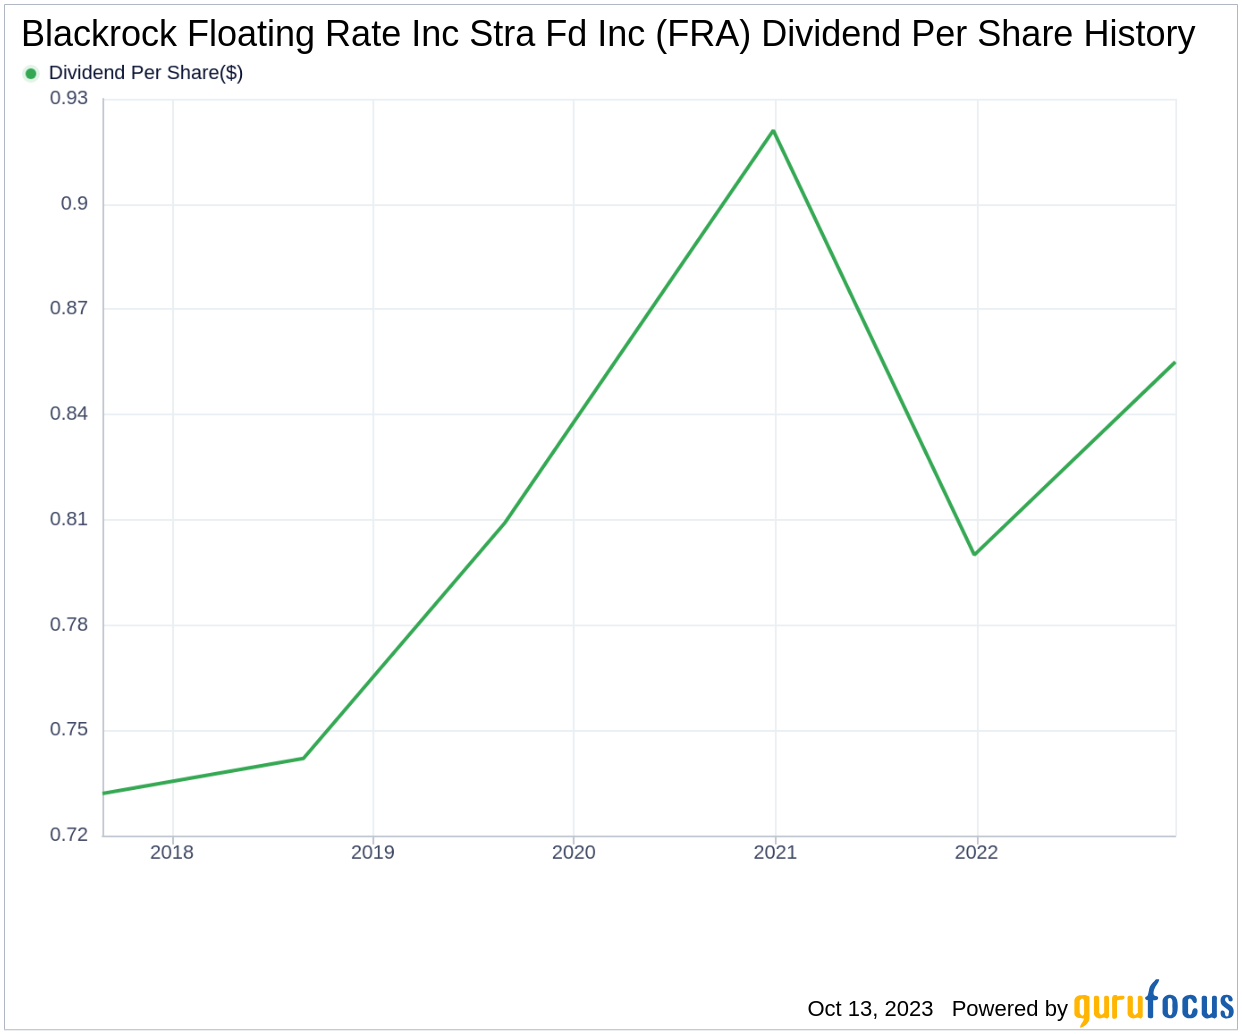
A Glimpse at Blackrock Floating Rate Inc Stra Fd Inc's Dividend History
Since 2003, Blackrock Floating Rate Inc Stra Fd Inc has maintained a consistent dividend payment record. Dividends are currently distributed on a monthly basis. The chart below showcases the annual Dividends Per Share for tracking historical trends.
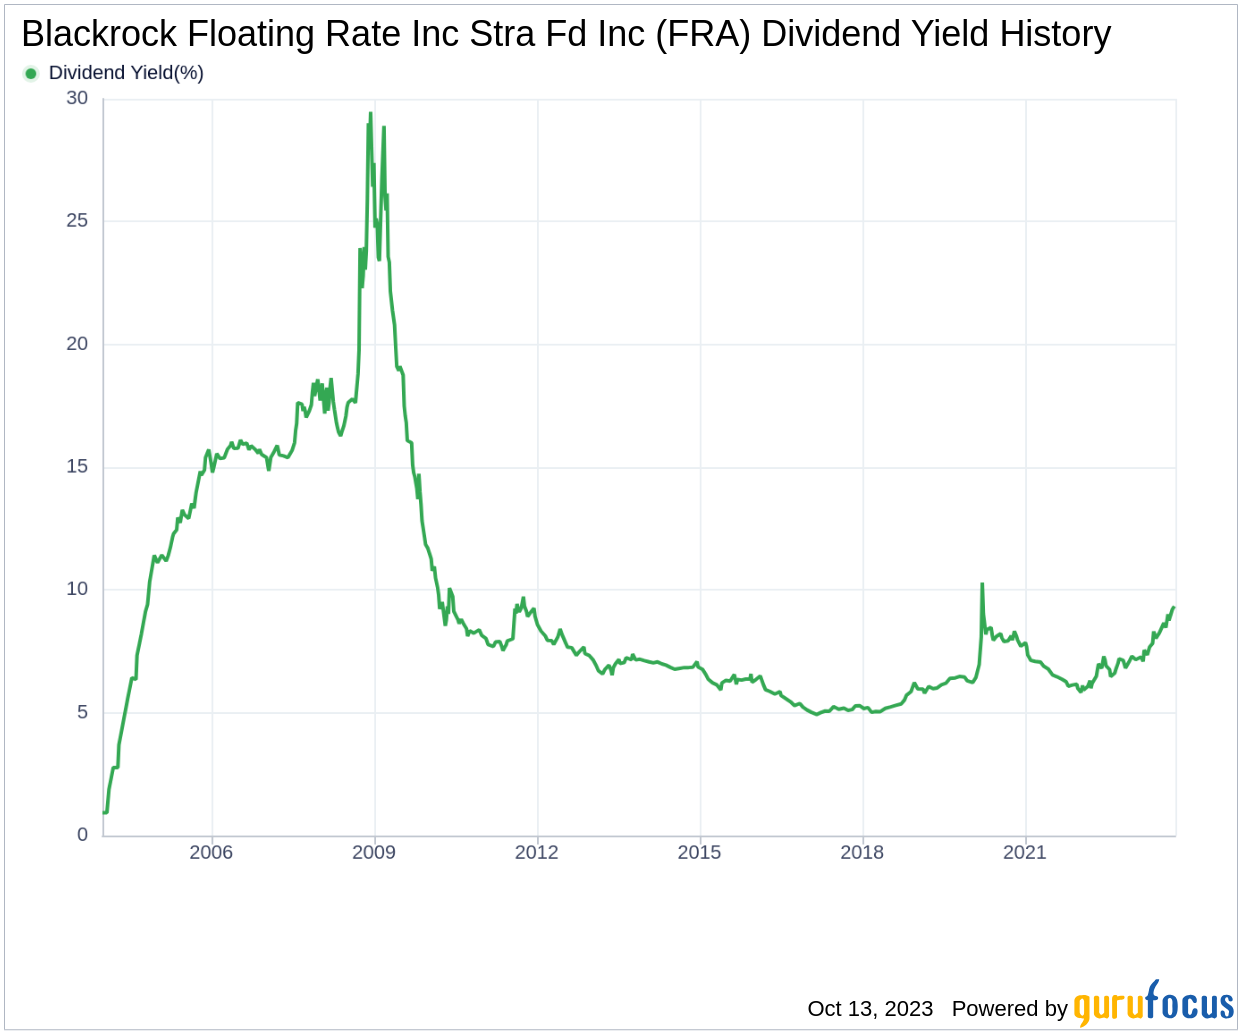
Breaking Down Blackrock Floating Rate Inc Stra Fd Inc's Dividend Yield and Growth
Blackrock Floating Rate Inc Stra Fd Inc currently has a 12-month trailing dividend yield of 9.64% and a 12-month forward dividend yield of 11.22%. This suggests an expectation of increased dividend payments over the next 12 months.
The company's dividend yield of 9.64% is near a 10-year high and outperforms 75.27% of global competitors in the Asset Management industry, indicating that the company's dividend yield is an attractive proposition for income investors.
Over the past three years, Blackrock Floating Rate Inc Stra Fd Inc's annual dividend growth rate was 1.90%. Extended to a five-year horizon, this rate increased to 3.30% per year. Based on the company's dividend yield and five-year growth rate, the 5-year yield on cost of Blackrock Floating Rate Inc Stra Fd Inc stock is approximately 11.34% as of today.
The Sustainability Question: Payout Ratio and Profitability
To gauge the sustainability of the dividend, it's crucial to examine the company's payout ratio. The dividend payout ratio reveals the proportion of earnings the company distributes as dividends. A lower ratio suggests that the company retains a significant part of its earnings, thereby ensuring the availability of funds for future growth and unexpected downturns. As of 2023-06-30, Blackrock Floating Rate Inc Stra Fd Inc's dividend payout ratio is 0.64.
Blackrock Floating Rate Inc Stra Fd Inc's profitability rank is 2 out of 10 as of 2023-06-30, suggesting that the dividend may not be sustainable in the long term. The company has reported net profit in 5 years out of the past 10 years.
Growth Metrics: The Future Outlook
For dividends to be sustainable, a company must exhibit robust growth metrics. Blackrock Floating Rate Inc Stra Fd Inc's growth rank of 2 out of 10 suggests that the company has poor growth prospects, which may impact the sustainability of its dividends.
Conclusion
While Blackrock Floating Rate Inc Stra Fd Inc's consistent dividend payment record and attractive yield are noteworthy, its low profitability and growth ranks raise concerns about the sustainability of its dividends. Investors should consider these factors when evaluating the company's dividend performance. GuruFocus Premium users can screen for high-dividend yield stocks using the High Dividend Yield Screener.
This article, generated by GuruFocus, is designed to provide general insights and is not tailored financial advice. Our commentary is rooted in historical data and analyst projections, utilizing an impartial methodology, and is not intended to serve as specific investment guidance. It does not formulate a recommendation to purchase or divest any stock and does not consider individual investment objectives or financial circumstances. Our objective is to deliver long-term, fundamental data-driven analysis. Be aware that our analysis might not incorporate the most recent, price-sensitive company announcements or qualitative information. GuruFocus holds no position in the stocks mentioned herein.