

Investors often grapple with the challenge of determining the true value of a stock in the ever-fluctuating market. For Lancaster Colony Corp (LANC, Financial), a recent dip of -1.42% in its stock price and a 3-month loss of -4.23% raise the question: Is the stock modestly undervalued? With an Earnings Per Share (EPS) of 4.26, a closer look at the company's valuation is warranted. This article delves into the financials and intrinsic value of Lancaster Colony to provide investors with a comprehensive analysis.
Company Introduction
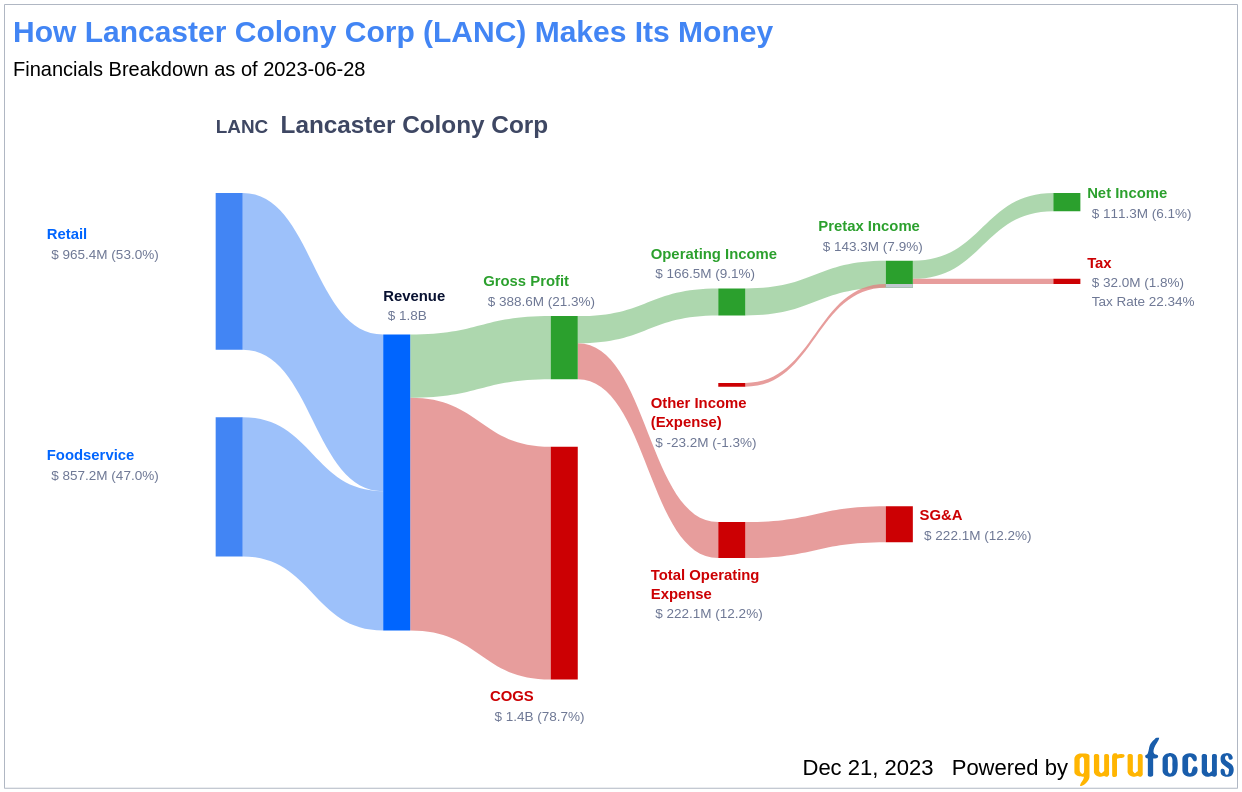
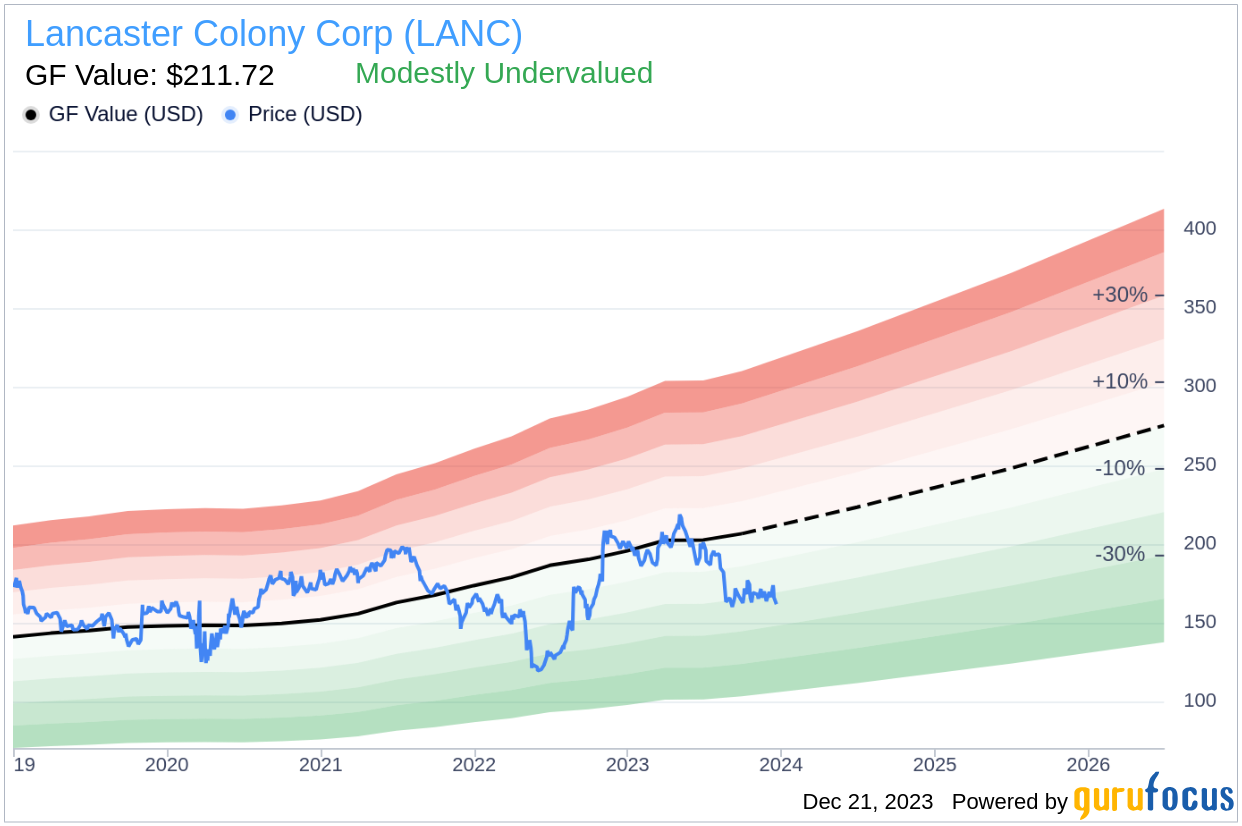
Lancaster Colony Corp is a seasoned player in the specialty food products industry, with a focus on both retail and foodservice segments. The company's diverse portfolio includes well-known brands in dressings, sauces, frozen breads, and noodles. A comparison of Lancaster Colony's current stock price of $161.88 to its Fair Value (GF Value) of $211.72, as estimated by GuruFocus, suggests that the stock may indeed be undervalued. This introductory analysis sets the stage for a deeper evaluation of Lancaster Colony's financial health and market position.
Summarize GF Value
The GF Value is a unique measure that captures the intrinsic value of a stock, taking into account its historical trading multiples, a GuruFocus adjustment factor based on past performance and growth, as well as future business prospects. Lancaster Colony (LANC, Financial) appears modestly undervalued according to this metric. The GF Value suggests an ideal fair trading value, with the stock's future returns likely to be higher if it trades below this line. With a market cap of $4.50 billion, Lancaster Colony's current price points to a potential undervaluation, signaling an opportunity for investors seeking long-term growth.
Link: These companies may deliver higher future returns at reduced risk.
Financial Strength
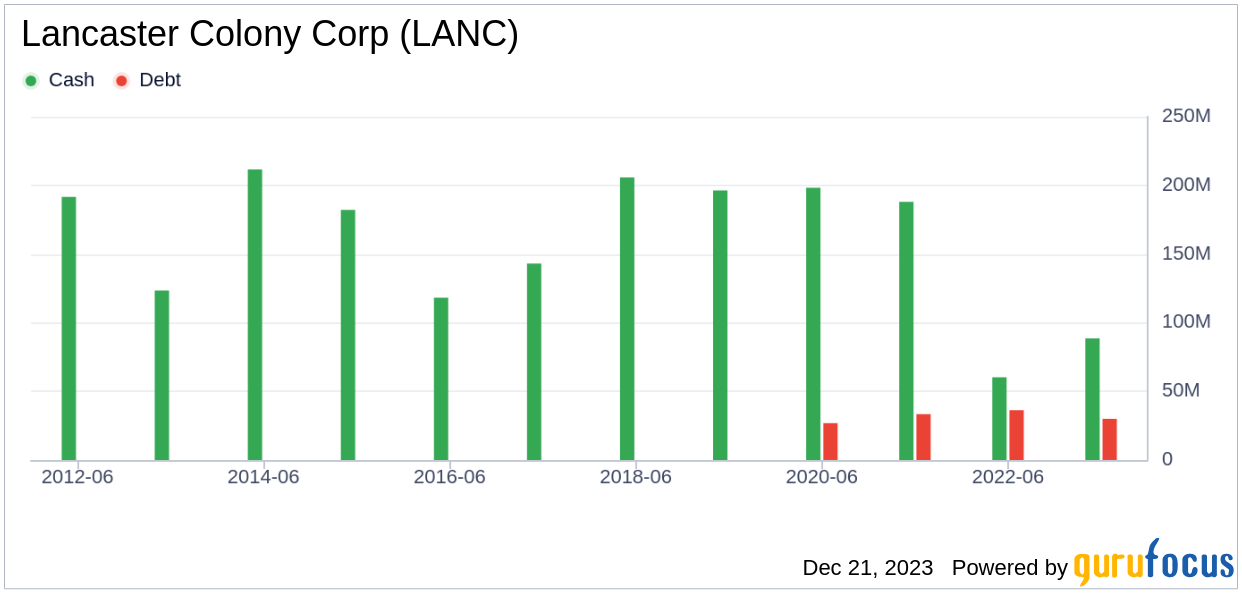
Investing in a company with a solid financial strength is crucial to mitigate the risk of capital loss. Lancaster Colony's cash-to-debt ratio of 4.82 places it in a favorable position within the industry. This strong financial standing, with a GuruFocus ranking of 8 out of 10, suggests that Lancaster Colony has a robust balance sheet capable of weathering market uncertainties.
Profitability and Growth
A consistent track record of profitability is a hallmark of a less risky investment. Lancaster Colony has maintained profitability for the past decade, with an operating margin of 9.36%, ranking higher than the majority of its peers. This strong profitability, coupled with a robust annual revenue of $1.90 billion and an EPS of $4.26, underscores the company's financial health.
Growth is a critical determinant of a company's valuation and its potential to create shareholder value. Lancaster Colony's 3-year average annual revenue growth rate of 11% is commendable, although its EBITDA growth rate is less impressive. Despite this, the company's overall growth prospects remain attractive.
ROIC vs WACC
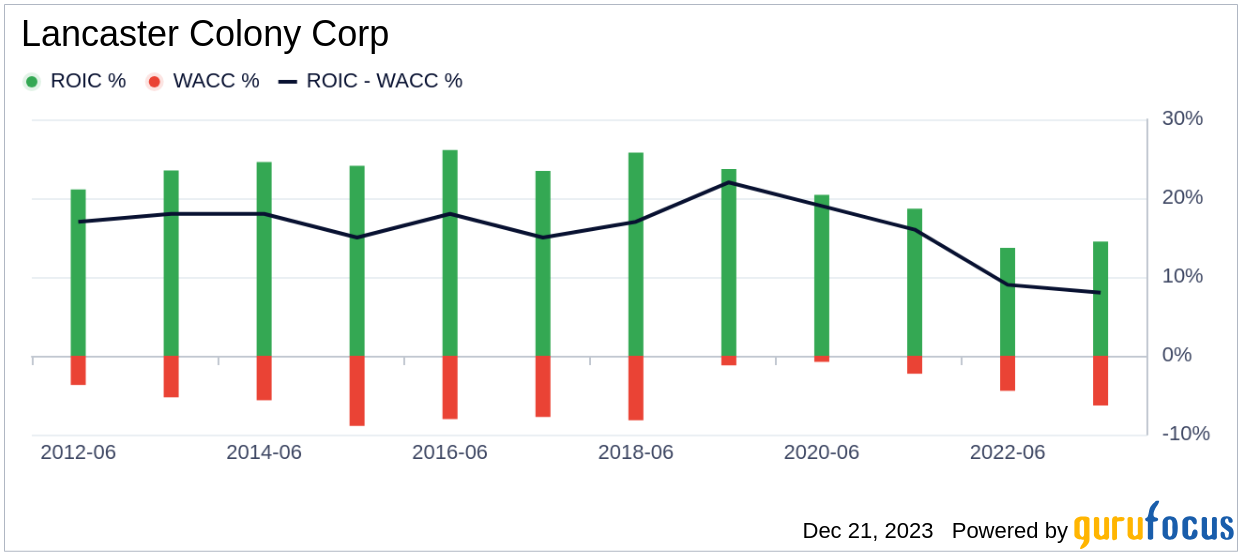
Comparing Return on Invested Capital (ROIC) to the Weighted Average Cost of Capital (WACC) provides insight into a company's efficiency in generating cash flow relative to its invested capital. Lancaster Colony's ROIC of 15.32 significantly surpasses its WACC of 5.89, indicating efficient capital management and promising returns for investors.
Conclusion
After a thorough examination, Lancaster Colony (LANC, Financial) presents as modestly undervalued. The company's financial robustness and profitability are impressive, though its growth rate could be a concern for some investors. To delve deeper into Lancaster Colony's financial journey, one can review its 30-Year Financials here.
To discover high-quality companies that may offer above-average returns, consider exploring the GuruFocus High Quality Low Capex Screener.
This article, generated by GuruFocus, is designed to provide general insights and is not tailored financial advice. Our commentary is rooted in historical data and analyst projections, utilizing an impartial methodology, and is not intended to serve as specific investment guidance. It does not formulate a recommendation to purchase or divest any stock and does not consider individual investment objectives or financial circumstances. Our objective is to deliver long-term, fundamental data-driven analysis. Be aware that our analysis might not incorporate the most recent, price-sensitive company announcements or qualitative information. GuruFocus holds no position in the stocks mentioned herein.