
Long-established in the Travel & Leisure industry, Royal Caribbean Group (RCL, Financial) has enjoyed a stellar reputation. It has recently witnessed a daily gain of 0.86%, juxtaposed with a three-month change of 40.52%. However, fresh insights from the GF Score hint at potential headwinds. Notably, its diminished rankings in financial strength, growth, and valuation suggest that the company might not live up to its historical performance. Join us as we dive deep into these pivotal metrics to unravel the evolving narrative of Royal Caribbean Group.
What Is the GF Score?
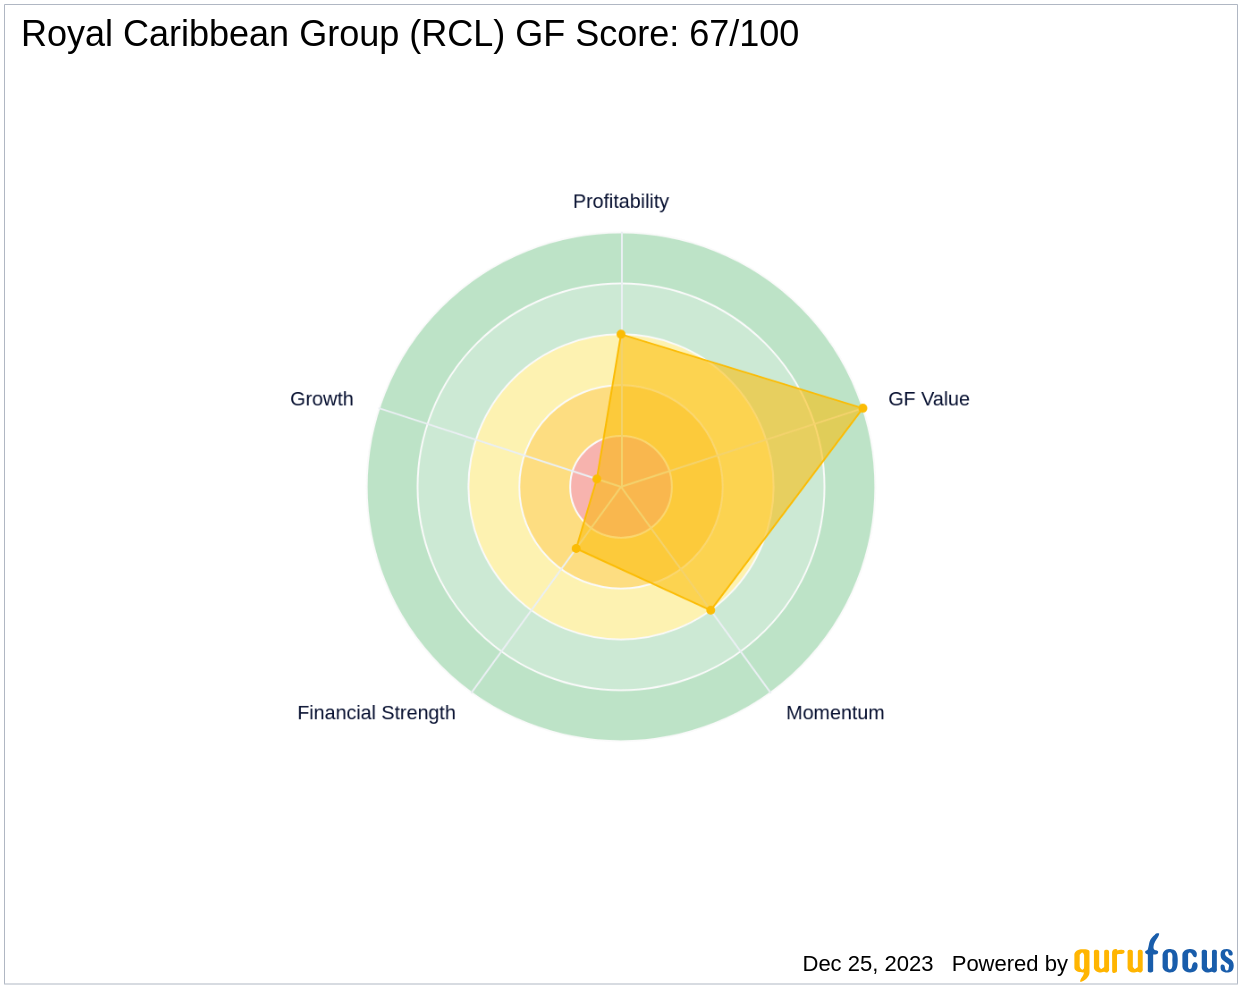
The GF Score is a stock performance ranking system developed by GuruFocus using five aspects of valuation, which has been found to be closely correlated to the long-term performances of stocks by backtesting from 2006 to 2021. The stocks with a higher GF Score generally generate higher returns than those with a lower GF Score. Therefore, when picking stocks, investors should invest in companies with high GF Scores. The GF Score ranges from 0 to 100, with 100 as the highest rank.
- Financial strength rank: 3/10
- Profitability rank: 6/10
- Growth rank: 1/10
- GF Value rank: 10/10
- Momentum rank: 6/10
Based on the above method, GuruFocus assigned Royal Caribbean Group the GF Score of 67 out of 100, which signals poor future outperformance potential.
Understanding Royal Caribbean Group's Business
Royal Caribbean Group, with a market cap of $32.85 billion and sales of $13.17 billion, operates as the world's second-largest cruise company. It boasts an operating margin of 17.65% and runs 64 ships across five global and partner brands in the cruise vacation industry, with 10 more ships on order. The company's portfolio includes Royal Caribbean International, Celebrity Cruises, and Silversea, and it holds a 50% investment in a joint venture that operates TUI Cruises and Hapag-Lloyd Cruises. This diverse brand array allows Royal Caribbean Group to compete on innovation, quality of ships and service, variety of itineraries, choice of destinations, and price. The company completed the divestiture of its Azamara brand in the first quarter of 2021.

Financial Strength Breakdown
Royal Caribbean Group's financial strength indicators present some concerning insights about the company's balance sheet health. The interest coverage ratio of 1.56 positions it worse than 76.06% of 589 companies in the Travel & Leisure industry, signaling potential challenges in managing interest expenses. The Altman Z-Score of just 1.06, below the distress zone of 1.81, suggests possible financial distress in the near future. A low cash-to-debt ratio at 0.03 indicates struggles with existing debt levels, while a debt-to-equity ratio of 4.65, worse than 93.21% of industry peers, suggests an over-reliance on borrowing. Furthermore, a debt-to-Ebitda ratio of 5.33 exceeds Joel Tillinghast's warning level of 4, indicating potential red flags unless tangible assets cover the debt.
Growth Prospects
A lack of significant growth is another area where Royal Caribbean Group seems to falter, as evidenced by the company's low Growth rank. The company's revenue has declined by an average of -12.7% per year over the past three years, underperforming 74.35% of 764 companies in the Travel & Leisure industry. This stagnation may raise concerns in a rapidly evolving market. Additionally, Royal Caribbean Group's predictability rank is just one star out of five, adding to investor uncertainty regarding revenue and earnings consistency.

Next Steps
Considering Royal Caribbean Group's financial strength, profitability, and growth metrics, the GF Score highlights the firm's unparalleled position for potential underperformance. Investors seeking to navigate these turbulent waters should weigh these factors carefully. For those looking to identify more robust investment opportunities, GuruFocus Premium members can explore companies with strong GF Scores using the GF Score Screen.
This article, generated by GuruFocus, is designed to provide general insights and is not tailored financial advice. Our commentary is rooted in historical data and analyst projections, utilizing an impartial methodology, and is not intended to serve as specific investment guidance. It does not formulate a recommendation to purchase or divest any stock and does not consider individual investment objectives or financial circumstances. Our objective is to deliver long-term, fundamental data-driven analysis. Be aware that our analysis might not incorporate the most recent, price-sensitive company announcements or qualitative information. GuruFocus holds no position in the stocks mentioned herein.