
PayPal Holdings Inc (PYPL, Financial) has recently been in the spotlight, drawing interest from investors and financial analysts due to its robust financial stance. With shares currently priced at $67.29, PayPal Holdings Inc has witnessed a daily gain of 1.95%, marked against a three-month change of 8.61%. A thorough analysis, underlined by the GF Score, suggests that PayPal Holdings Inc is well-positioned for substantial growth in the near future.
What Is the GF Score?
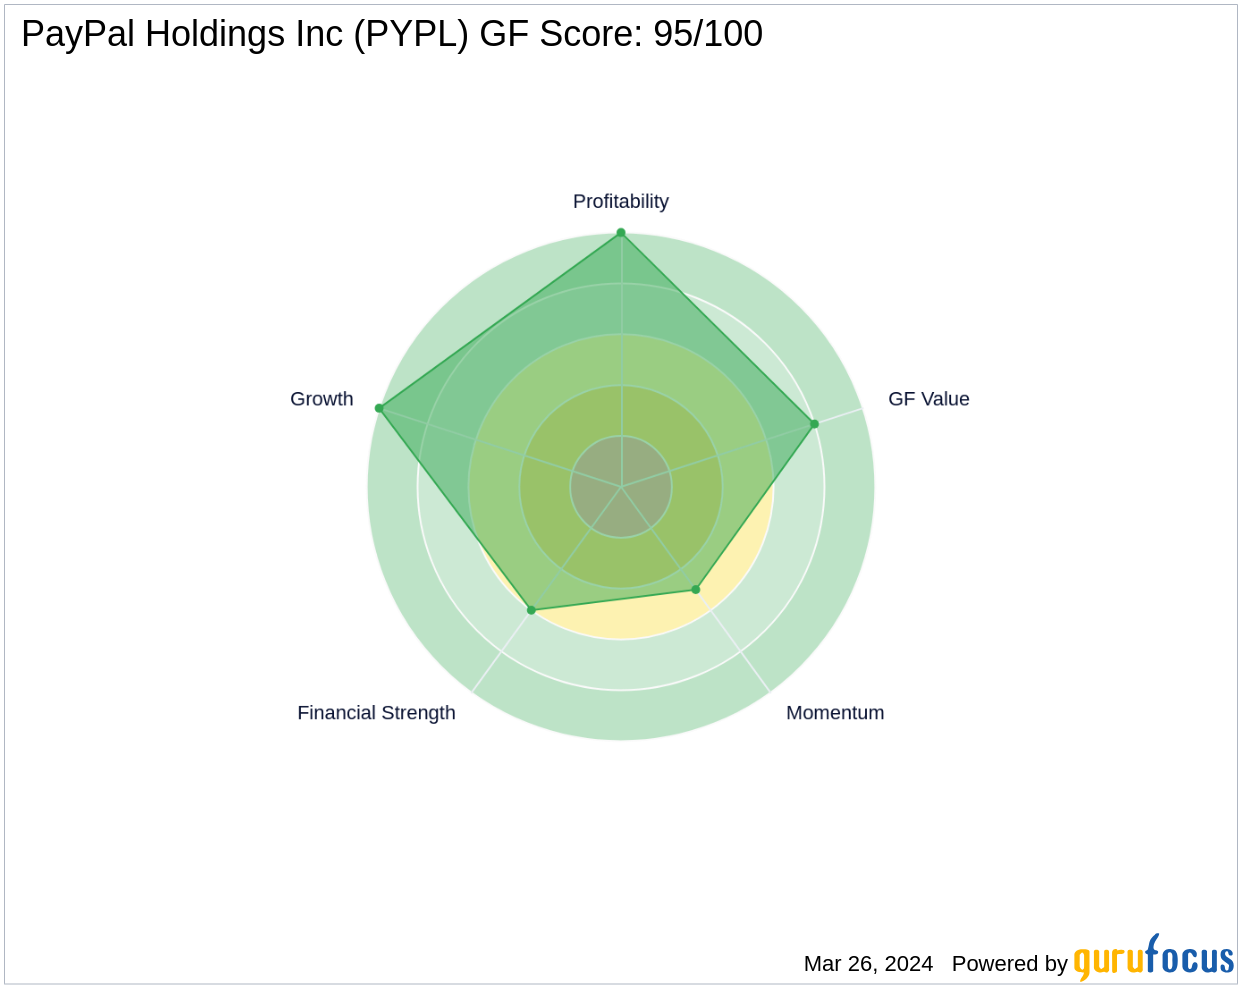
The GF Score is a stock performance ranking system developed by GuruFocus using five aspects of valuation, which has been found to be closely correlated to the long-term performances of stocks by backtesting from 2006 to 2021. The stocks with a higher GF Score generally generate higher returns than those with a lower GF Score. Therefore, when picking stocks, investors should invest in companies with high GF Scores. The GF Score ranges from 0 to 100, with 100 as the highest rank.
- Financial strength rank: 6/10
- Profitability rank: 10/10
- Growth rank: 10/10
- GF Value rank: 8/10
- Momentum rank: 5/10
Considering these components, GuruFocus assigned PayPal Holdings Inc a GF Score of 95 out of 100, which signals the highest outperformance potential.
Understanding PayPal Holdings Inc's Business
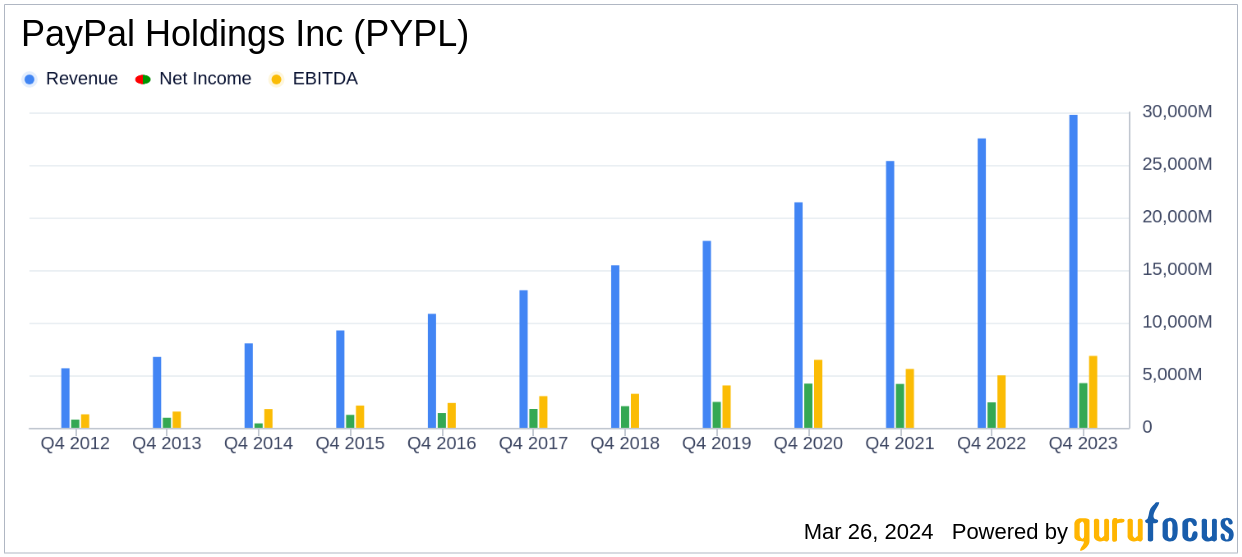
PayPal Holdings Inc, with a market cap of $72.12 billion and sales of $29.77 billion, has established itself as a leader in electronic payment solutions. Since its spin-off from eBay in 2015, PayPal has focused on facilitating online transactions for merchants and consumers. By the end of 2023, the company boasted 426 million active accounts and also owns Venmo, a popular person-to-person payment platform. With an operating margin of 16.61%, PayPal Holdings Inc demonstrates efficient management and a strong competitive position in the digital payments industry.

Financial Strength Breakdown
According to the Financial Strength rating, PayPal Holdings Inc's robust balance sheet exhibits resilience against financial volatility, reflecting prudent management of capital structure. The Interest Coverage ratio for PayPal Holdings Inc stands impressively at 14.25, underscoring its strong capability to cover its interest obligations. With a favorable Debt-to-Revenue ratio of 0.33, PayPal Holdings Inc's strategic handling of debt solidifies its financial health.
Profitability Rank Breakdown
The Profitability Rank shows PayPal Holdings Inc's impressive standing among its peers in generating profit. The company's Operating Margin has increased over the past five years, with a current figure of 16.61%. The Piotroski F-Score confirms PayPal Holdings Inc's solid financial situation, and its strong Predictability Rank of 5.0 stars out of five underscores its consistent operational performance.
Growth Rank Breakdown
Ranked highly in Growth, PayPal Holdings Inc demonstrates a strong commitment to expanding its business. The company's 3-Year Revenue Growth Rate is 14.2%, which outperforms better than 66.94% of companies in the Credit Services industry. Moreover, PayPal Holdings Inc has seen a robust increase in its EBITDA over the past few years, highlighting its continued capability to drive growth.
Next Steps
Considering PayPal Holdings Inc's financial strength, profitability, and growth metrics, the GF Score highlights the firm's unparalleled position for potential outperformance. Investors seeking to capitalize on such robust financial health and market position should consider the insights provided by the GF Score. For more investment opportunities, GuruFocus Premium members can explore companies with strong GF Scores using the GF Score Screen.
This article, generated by GuruFocus, is designed to provide general insights and is not tailored financial advice. Our commentary is rooted in historical data and analyst projections, utilizing an impartial methodology, and is not intended to serve as specific investment guidance. It does not formulate a recommendation to purchase or divest any stock and does not consider individual investment objectives or financial circumstances. Our objective is to deliver long-term, fundamental data-driven analysis. Be aware that our analysis might not incorporate the most recent, price-sensitive company announcements or qualitative information. GuruFocus holds no position in the stocks mentioned herein.