

Oil has been in my “too hard” bucket the last six months. I couldn’t identify any catalyst that could drive it out of its trading range. I mostly expected it to chop around which has turned out to be the case.
But it’s time I revisit oil and see if there’s anything on the horizon that could ignite a tradable trend in the near future. With many U.S. E&Ps selling for what appears on the surface to be cheap, along with the oil and gas servicing industry trading at historically low relative values to the oil price; now seems like a good time to dig in.
To kick things off I’m going to share the framework I use to view the energy market. And we’ll then use that as a guide to understand the current environment.
To begin, I analyze every market from three vantage points. These are:
- Macro: This is the big picture supply and demand fundamentals of the market, along with the attributable macro/liquidity factors that drive them.
- Sentiment: I want to know what the market is thinking, what the dominant narratives are and how the players are positioned. We want a finger on the pulse so we can understand the expectations embedded in price.
- Technical: What’s the tape saying? I note areas of support and resistance and where the path of least resistance might lie.
Macro
A useful model for thinking about supply and demand in oil, or any cyclical market, is to view it through the lens of the capital cycle which often moves in lockstep with the debt cycle.
In doing this it’s key to remember that we’re more interested in what the supply and demand picture will look like in the future (i.e., 18 to 24 months down the road). The fundamentals of today are already reflected in price, and we always want to be forward looking but use present-day data as an input in our framework.
Using the lens of the capital cycle or investment cycle framework, we’re concerned with how past, present and future investment (CAPEX) is going to affect future supply as well as the macro variables that drive demand.
The chart below from the book "Capital Returns" illustrates how the capital cycle works. I’ve written more about this process here.

Here’s a note from the hedge fund Bridgewater laying out the various stages of this cycle.
- In the first phase, a pickup in commodity-intensive growth causes a global surge in demand for commodities to outstrip supply. As demand pushes up against capacity limits, prices rise.
- In the second phase, high prices caused by the supply and demand imbalance induce large amounts of capital expenditure. As prices rise, margins for commodity producers widen and profits increase. These producers, flush with cash and looking at high prices, invest in profitable opportunities to expand production. There is a massive investment boom. This acts as a support to growth and inflation as capital expenditure accelerates.
- The third phase is typically marked by a slowdown in commodity demand that occurs when the original growth that sparked the cycle fades and high prices incentivize reductions in demand growth by encouraging substitution and efforts to improve efficiency. Simultaneously, the investment boom begins to bring new supply online, demand/supply imbalances ease, and prices stabilize. Thus, high prices help set in motion the increase in supply and reduction in demand that eventually lead to the turning of the cycle.
- In the fourth phase, there is a supply glut. The balance between demand and supply swings sharply in the other direction, as production is much greater than demand. This phase is typically characterized by large price declines.
- As prices fall, margins for commodity producers are squeezed. In the fifth phase, producers respond to low prices by slashing investment and in some cases shutting down production permanently. This decline in supply eventually brings the market back into balance as the low investment deteriorates capacity, sowing the seeds for the next cycle.
Four of these long-term oil investment cycles have played out over the last century (chart via Bridgewater).

Let’s break down the current cycle by stage so we can see where we sit.
Stage one
The current oil investment cycle began in the early 2000s. There were three primary drivers that spawned a pickup “in commodity-intensive growth.” These were (1) the beginning of a cyclical bear market in U.S. dollars, (2) extremely easy monetary policy by the Fed following the collapse of the U.S. tech bubble which sent capital flowing out of the U.S. and into emerging markets in search of returns and (3) accelerating growth in China that led to booming demand for commodities sparking a reflexive emerging market growth story.
This growth story in the periphery led to a large pickup in demand which pushed up against capacity limits causing oil prices to rise.
Stage two
Rising prices caused by the large supply and demand imbalance meant widening margins and greater profits for producers of oil and gas. Increasing returns on capital attracted new investment into capacity and an investment boom was started. The Fed’s loose monetary policy along with a falling dollar made capital cheap and readily available which led to more borrowing and more investment in future capacity.
All of this investment acted as a short-term boost to demand/growth which further led to rising commodity prices (a reflexive growth story).
Stage three
It began following the global financial crisis in 2009. This led to a slowdown in commodity demand growth.
The old economic adage –Â “the cure for high prices is higher prices” –Â applies to this stage.
High oil prices incentivized new technology to lower extraction costs (i.e., fracking) as well as lower consumption (i.e., greater vehicle fuel efficiency).
This led to the unsustainable situation where we had high oil prices with lots of new supply coming online (from both fracking and conventional sources) while demand growth was falling due to more efficient vehicles and a tepid global economy.
Stage three was extended by large Chinese credit injections into its economy along with massive centrally planned commodity intensive investment projects. At one point, around 2010, China comprised something like 60%-plus of the world's annual commodity consumption – which is larger than any share of demand by a single country in history.
Stage four
In 2014 China’s growth began to slow. Also, the Fed began to signal the beginning of the end of its easy monetary policy. This led to diverging expected rate paths between the U.S. and ROW which kicked off a bull market in U.S. dollars. And since oil is priced in dollars, a higher dollar means oil becomes more expensive on a relative basis to the rest of the world. This leads to lower demand and is why the two move inversely to one another. At the same time, new production capacity was coming online as the result of investments made years earlier.
A supply glut plus a rising dollar led to the collapse of oil prices in 2014.

Stage five
Falling oil prices led to compressed margins and lower profits for commodity producers. At the same time, tighter U.S. monetary policy and a rising dollar led to tighter liquidity in emerging markets which sent the reflexive growth story into reverse. Oil producers responded to the lower prices and tighter liquidity by reducing costs, cutting investment and shutting down unprofitable production.
This is where we find ourselves now.
Low oil prices have led to draconian level reductions in CAPEX. Remember, lower CAPEX today means lower supply in the future. Take a look at the chart below, showing global CAPEX in oil and gas.

Global oil and gas investment, as a percentage of GDP, has collapsed from a cycle high of 0.9% in 2014 to just 0.4% today.
That means CAPEX in future capacity is now less than half what it was just a few years ago. This makes it one of the largest capex reductions to global oil and gas capacity in history.
Knowing that, it’s hard to imagine a future (next one to three years) where we don’t enter an extremely supply constrained environment which would send oil prices much higher.

But one of the things that’s delaying this imbalance from showing up in price is U.S. shale producers pumping at a loss and only being kept alive by cheap financing. Read the following from the FT:
As one Oklahoma oil and gas man I know says: “There is still unlimited capital, and as long as that is true, you can grow anything. If the companies had been forced to live within their cash flow, then their production would go down. Then they would have run into a death spiral where nobody would want to invest in them.”
The shale companies struggling with sub-$40 or sub-$50 oil prices were also able to live off the excess inventory of drilled-but-uncompleted (DUC) wells that had built up during the boom years.
As our Oklahoman says: “There were thousands of DUCs that had not been taken account of. The companies could just complete and connect those to offset the declines in production from older wells.”
Along with the sunk-cost inventory and cheap refinancing, the U.S. E&P companies made real advances in the use of geoscience to find new oil in already-known fields. They also drilled longer lateral holes and made more effective use of fracking techniques. So productivity went way up in places such as the Permian Basin in Texas.
While fracking has placed a temporary ceiling on oil, it’s only going to last as long as financing remains available (i.e., rates low).
But this doesn’t permanently change the longer-term supply and demand picture. Here’s Jeremy Grantham (Trades, Portfolio) of GMO on why:
"After 1999 the costs of finding new oil started to rise very rapidly. By today, in my opinion, the price needed to support the development of new oil reserves has risen to at least $65 a barrel. This rise from $16 (in today’s currency) constitutes a second paradigm shift in oil. Less is found each year in smaller fields and is more difficult and costly to extract."
- U.S. fracking oil is a small resource, under 1½ years of global consumption. It will soon run off and show the underlying implacable rising costs of finding ever-diminishing pools of new oil.
- Existing oil wells deplete faster than they used to because enhanced technologies squeeze more into the early years. Over 5 million barrels a day out of a global total of 95 a year now needs to be replaced every year. Half a new Saudi Arabia!
- Today’s draconian cutbacks in exploration almost guarantee another sharp price spike in the next two to four years.
Another short-term factor that’s been weighing oil prices down is high levels of inventory that have been papering over the supply gap.
Over the last two years, a steep futures curve incentivized the increase in storage capacity. This is when higher future prices make it profitable to buy oil now and store it to sell at a later date. This steep curve led to a glut in inventories within OECD countries and with the U.S. nearly maxing out its storage capacity.
But over the last year the curve has started to flatten. This is leading to inventories being drawn down which is bullish for the oil price down the road. You can see the curve/inventory relationship on the chart below showing the WTI 12 million futures price over spot, along with the year-over-year change in U.S. inventories.

Another factor that muddies the macro picture is that we’re in the early stages of a major technologically driven secular change with the rise of electric vehicles (EVs). This will eventually have a major impact on the price of oil; the only question is when.
Transportation is by far the largest source of oil demand, comprising over 55% of global consumption with passenger vehicles making up about one-fourth of total demand.

Increasing fuel efficiencies and the rise of hybrid and pure EVs spell trouble for high-cost oil producers. And there are a number of countries that are trying to accelerate this trend to greener tech through policy and regulation.
For example, the U.K. and France have formalized plans to ban fossil fuel vehicles over the next two decades.
The U.S.’s CAFE standards are forcing automakers to produce ever more fuel-efficient cars. And China, the largest market for EVs last year, is aiming to be the largest maker of lithium-ion batteries as well as increase the number of hybrids and EVs on its roads from 2 million by 2020 to 7 million within a decade.
And while the transition to EVs will eventually remake the energy market – not to mention have cascading and long-term geopolitical impacts – I’m suspicious of the speed at which this secular shift occurs along with its near-term (over the next five years) impact on the price of oil.
EVs make up a tiny fraction of the total auto market. Just last year there were only 750,000 EVs sold around the world which is less than 1% of the new car market and only 0.2% of the total market.
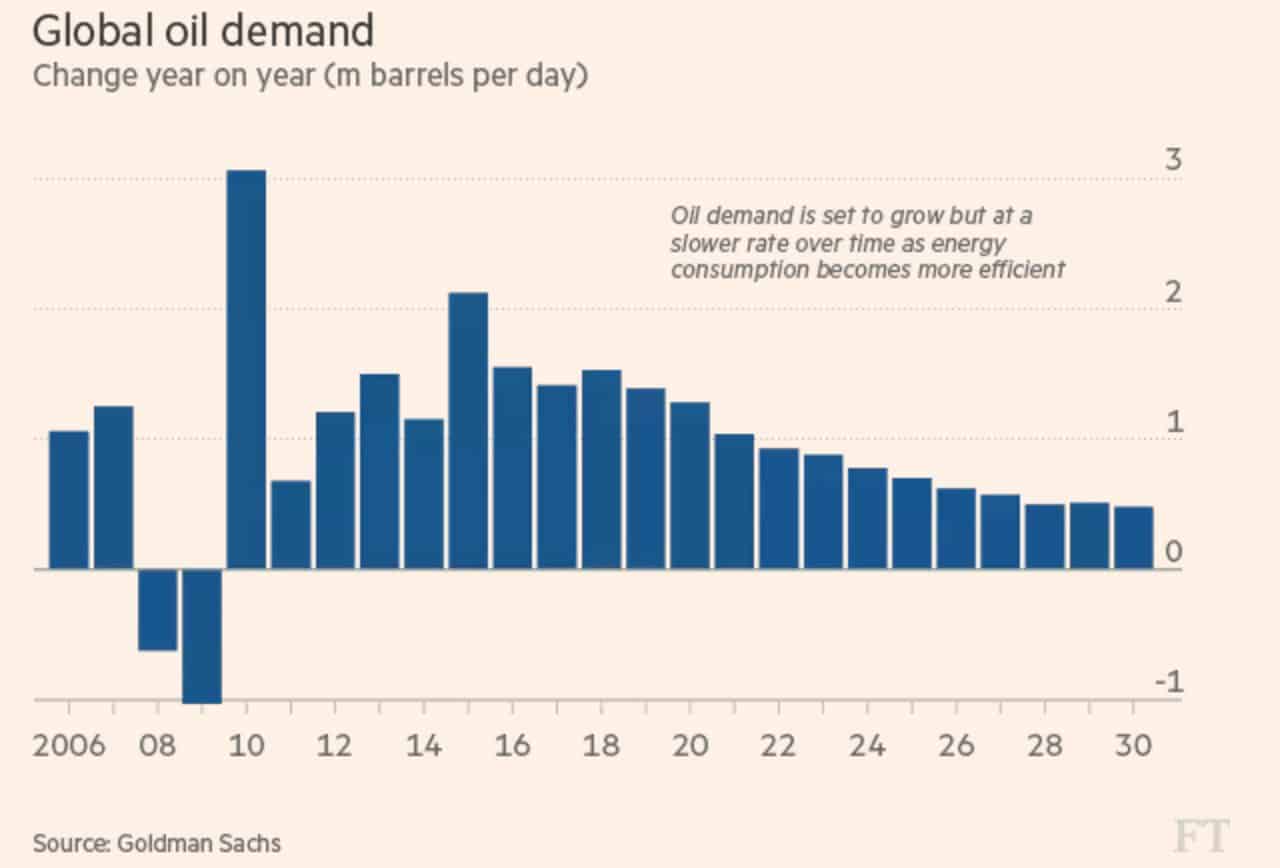
The International Energy Agency (IEA) is forecasting demand for oil to fall by 12% in OECD countries over the next decade. But it’s expected to grow by 19% in non-OECD countries over the same period and where, by that time, over 60% of global oil demand will come from these developed markets.
Even though the fuel intensity of global growth is declining, the aggregate level of demand will continue to rise, at least into the foreseeable future.
The macro backdrop for oil can be summarized by the following:
- We’re in the fifth stage of an oil investment cycle (i.e., capital cycle).
- A record amount of global oil and gas investment has been cut over the last three years which is going to lead to a highly supply constrained environment sometime in the next one to three years.
- This phase is being drawn out by low interest rates and cheap financing allowing unproductive producers to stay in business.
- The global credit cycle is also being extended by China’s credit injections which is propping up demand and is likely to continue into its November Congress.
- The short-term supply glut has been exacerbated by a steep curve that led to record high inventories. But over the last year the curve has begun to flatten bringing inventories down with it.
- The rise of EVs will eventually reshape the energy landscape, but that future is still a ways off.
As one analyst was quoted in the FT, “The Permian is preventing high prices today but ensuring high oil prices tomorrow. The low prices are holding back investment in most of the world, and that is storing up a significant problem in meeting demand in the future.”
Sentiment
For sentiment I like to track things like speculative positioning in COT, open interest and commercial hedging, fund flows and positioning data, and the futures time spread, along with other more qualitative factors like news flow and popular narratives.
And when looking at sentiment I’m looking for signs of extreme consensus. Instances where it appears there’s dominant narrative adoption and positioning is one-sided. Like Bruce Kovner said, we want to look for a “consensus the market is not confirming. I like to know that there are a lot of people who are going to be wrong.”
And right now, I’m not seeing any evidence of extreme or consensus sentiment in the oil market.
There’s some anecdotal evidence of the bearish oil narrative gaining adoption along with some notable longtime energy bulls being forced to close up shop. But these aren’t near the extremes that are indicative of a major trend change.
You can take a look at the COT chart below via FreeCOTData as an example. Specs were extremely bullish at the beginning of the year but have since tapered off to more neutral-bullish positioning.

I can foresee a scenario where oil prices stay low for a good deal longer causing a number of E&Ps to go belly up which would lead to the “Rise of the EVs” or “Death to the Combustion Engine” narrative gaining adoption. The Economist’s most recent cover is an example of this narrative becoming more popular.

Technicals
I’ve found the late '90s analog to be useful for today’s market. There’s a number of similarities (an extended core-driven equity and dollar bull market marked by an EM and commodity crisis) as well as many differences (i.e., definitely lacking the euphoria of the late '90s among other things).
Analogs have no predictive value whatsoever, but they’re still useful for getting a sense for what’s possible and what’s happened in the past under similar circumstances. This analog helped us catch the short dollar trade that started a couple of months ago.
With that said, the tape is following a similar pattern to its path in the late '90s, early 2000s. The chart below shows the oil price in monthly bars.

The way the macro data looks with a short-term supply glut persisting into the near future eventually leading to a large supply deficit in the next one to three years, plus the neutral to bullish sentiment and positioning, I would not be surprised to see price action largely mirror that of the early 2000s.
This would mean that oil would continue to chop around in its range. And there’d be a higher probability of it moving lower than higher over the next six months.
The potential 18-month H&S topping pattern in crude suggests this scenario may be starting to unfold.

My base case has the U.S. and global markets moving into an illiquid environment around the end of this year or beginning of next. This will reverse the fall in the dollar and kick off the final leg of the dollar bull market.
A rising dollar will further tighten global liquidity. And it’ll send oil and other commodities lower with crude falling back to somewhere in the $30 to $40bbl range.
During this time credit spreads will widen and financing for unproductive frackers will evaporate.
Sentiment will turn very bearish and adoption of the rise of EVs and other oil bearish narratives will become popular.
This will play out until the bull market in the dollar ends and a new commodity investment cycle begins.
In short, I don’t believe oil will start a major trend over the next six months and therefore isn’t worth trading at the moment. The fact that it’s been unable to rally out of its range to the upside while the dollar has been messing the bed suggests the short-term supply glut is still weighing on the market.
And since the recent weakness in the dollar is likely to reverse in the coming months, the path of least resistance for oil remains lower.
In the next one to two years, long oil will make for a great trade. This will happen once this capital cycle fully completes and that will be when rates rise, credit spreads widen and financing dries up leading to the last of the unproductive producers to come off line. Then we’ll enter a multiyear severely supply constrained market which should coincide with the start of a new bear market in the dollar.
This is currently my base case for oil. It’s just what I view to be the most probable path at this point in time, and I’ll be quick to flip my script should some new evidence, like war for example, change the outlook.