

"Wall Street is the only place that people ride to in a Rolls Royce to get advice from those who take the subway."
-- Warren Buffett (Trades, Portfolio)
Background
Warren Buffett (Trades, Portfolio) has been long famous for his criticisms of so-called "helpers," which are mainly buy-side fund managers, due to their no-value-added services and fees. But what about those sell-side Wall Street analysts? They are also regarded as elites of the financial industry thanks to their top educational backgrounds, high IQs, decent pay, and perhaps, smart looks.
Examining companies by studying their financial statements, earnings calls, industries, economies, and many other factors, this crowd provide stocks recommendations and can sometimes change the public opinion of a company to such extent that its share price may shift accordingly.
So should anyone rely on stock recommendations from Wall Street analysts? A back-testing will help answer the question.
Urbem Street Bullish Score
As the first step, I developed a ranking model to assign a score to each stock, reflecting the "bullishness" of the Street as of a certain point of time, by taking the following factors into account (weightings in descending order):
- The upside (if any) of the average price target.
- The upside (if any) of the low and high ends of price targets.
- The most recent average price target vs. four weeks ago.
- The number of analysts who give price targets.
I call the final score the "Urbem Street Bullish Score," which calculates the weighted sum of the above respective ranks. As you can imagine, the higher the score, the more bullish Wall Street analysts are on the stock in aggregate. Below are the 50 U.S.-listed stocks with the highest Street Bullish Scores (calculated by Portfolio123) as of May 4:
| Rank | Ticker | Name | 100% Stock Rank |
| 1 | MGI | MoneyGram International Inc | 98.45 |
| 2 | BMA | Banco Macro SA | 98.27 |
| 3 | VIPS | Vipshop Holdings Ltd | 98.24 |
| 4 | TRNX | Taronis Technologies Inc | 98.23 |
| 5 | JD | JD.com Inc | 98.11 |
| 6 | BRS | Bristow Group Inc | 97.99 |
| 7 | TRIL | Trillium Therapeutics Inc | 97.95 |
| 8 | LX | LexinFintech Holdings Ltd | 97.91 |
| 9 | ZTO | ZTO Express (Cayman) Inc | 97.55 |
| 10 | HTHT | Huazhu Group Ltd | 97.5 |
| 11 | BABA | Alibaba Group Holding Ltd | 97.47 |
| 12 | YNDX | Yandex NV | 97.39 |
| 13 | ROSYY | Rostelecom PJSC | 97.24 |
| 14 | NVO | Novo Nordisk A/S | 97.23 |
| 15 | TCEHY | Tencent Holdings LTD | 97.12 |
| 16 | WF | Woori Financial Group Inc | 97.11 |
| 17 | BZUN | Baozun Inc | 97.1 |
| 18 | FHL | Futu Holdings Ltd | 96.98 |
| 19 | BEDU | Bright Scholar Education Holdings Limited | 96.97 |
| 20 | BILI | Bilibili Inc | 96.92 |
| 21 | APVO | Aptevo Therapeutics Inc | 96.87 |
| 22 | GHG | Greentree Hospitality Group Ltd | 96.85 |
| 23 | CRBP | Corbus Pharmaceuticals Holdings Inc | 96.6 |
| 24 | NIU | Niu Technologies | 96.58 |
| 25 | CKPT | Checkpoint Therapeutics Inc | 96.57 |
| 26 | PAGS | PagSeguro Digital Ltd | 96.54 |
| 27 | ALPE | Alpha-En Corp | 96.54 |
| 28 | HUYA | HUYA Inc | 96.43 |
| 29 | BYSI | BeyondSpring Inc | 96.35 |
| 30 | ARDX | Ardelyx Inc | 96.31 |
| 31 | GDS | GDS Holdings Ltd | 96.29 |
| 32 | TAK | Takeda Pharmaceutical Co Ltd | 96.13 |
| 33 | PTI | Proteostasis Therapeutics Inc | 96.08 |
| 34 | ATNM | Actinium Pharmaceuticals Inc | 96.05 |
| 35 | RDY | Dr. Reddy's Laboratories Ltd | 96 |
| 36 | OVID | Ovid Therapeutics Inc | 95.98 |
| 37 | JT | Jianpu Technology Inc | 95.92 |
| 38 | VIVE | Viveve Medical Inc | 95.87 |
| 39 | FEDU | Four Seasons Education (Cayman) Inc | 95.84 |
| 40 | LN | LINE Corp | 95.81 |
| 41 | YTRA | Yatra Online Inc | 95.81 |
| 42 | UPL | Ultra Petroleum Corp. | 95.72 |
| 43 | ZEAL | Zealand Pharma AS | 95.69 |
| 44 | SNNA | Sienna Biopharmaceuticals Inc | 95.67 |
| 45 | SNGX | Soligenix Inc | 95.65 |
| 46 | EYEG | Eyegate Pharmaceuticals Inc | 95.63 |
| 47 | KB | KB Financial Group Inc | 95.59 |
| 48 | LAIX | LAIX Inc | 95.55 |
| 49 | LENSF | Presbia PLC | 95.53 |
| 50 | SPHS | Sophiris Bio Inc | 95.5 |
Source: Portfolio123; data as of May 4, 2019.
From the list, you may recognize many hot Chinese tech names, such as JD.com, Bilibili and Baozun. If we limit the scope to only U.S. large caps, which people are more familiar with, below is the result of running the scoring model across the S&P 500 constituents:
| Rank | Ticker | Name | 100% Stock Rank |
| 1 | PXD | Pioneer Natural Resources Co | 92.9 |
| 2 | MRO | Marathon Oil Corp | 92.23 |
| 3 | FANG | Diamondback Energy Inc | 91.42 |
| 4 | CXO | Concho Resources Inc | 89.57 |
| 5 | JEF | Jefferies Financial Group Inc | 89.29 |
| 6 | EOG | EOG Resources Inc. | 87.09 |
| 7 | NBL | Noble Energy Inc | 86.95 |
| 8 | DXC | DXC Technology Company | 86.92 |
| 9 | TPR | Tapestry Inc | 86.83 |
| 10 | CPRI | Capri Holdings Ltd | 86.77 |
| 11 | VLO | Valero Energy Corp | 85.71 |
| 12 | HAL | Halliburton Co | 85.12 |
| 13 | COP | ConocoPhillips | 84.77 |
| 14 | NKTR | Nektar Therapeutics | 84.6 |
| 15 | NEM | Newmont Goldcorp Corp | 84.49 |
| 16 | MOS | Mosaic Company | 84.24 |
| 17 | XEC | Cimarex Energy Co. | 84.11 |
| 18 | MPC | Marathon Petroleum Corp | 83.27 |
| 19 | CI | Cigna Corp | 83.03 |
| 20 | PSX | Phillips 66 | 82.98 |
| 21 | FCX | Freeport-McMoRan Inc | 82.23 |
| 22 | SLB | Schlumberger Ltd | 82.07 |
| 23 | MGM | MGM Resorts International | 81.87 |
| 24 | JWN | Nordstrom Inc. | 81.42 |
| 25 | CNC | Centene Corp | 81.09 |
| 26 | ANTM | Anthem Inc | 80.93 |
| 27 | PWR | Quanta Services Inc. | 80.93 |
| 28 | CBS | CBS Corp | 80.86 |
| 29 | HUM | Humana Inc. | 80.74 |
| 30 | LYB | LyondellBasell Industries NV | 80.46 |
| 31 | CVX | Chevron Corp | 80.39 |
| 32 | DAL | Delta Air Lines Inc | 80.39 |
| 33 | AGN | Allergan PLC | 79.71 |
| 34 | VIAB | Viacom Inc | 79.18 |
| 35 | REGN | Regeneron Pharmaceuticals Inc | 79.17 |
| 36 | BHGE | Baker Hughes a GE Co | 78.99 |
| 37 | HCA | HCA Healthcare Inc | 78.75 |
| 38 | CVS | CVS Health Corp | 78.62 |
| 39 | EIX | Edison International | 78.44 |
| 40 | GILD | Gilead Sciences Inc | 78.34 |
| 41 | FLR | Fluor Corp | 78.16 |
| 42 | FTI | TechnipFMC plc | 78.02 |
| 43 | LKQ | LKQ Corp | 77.89 |
| 44 | DVN | Devon Energy Corp | 77.83 |
| 45 | OXY | Occidental Petroleum Corp | 77.76 |
| 46 | DWDP | DowDuPont Inc | 77.32 |
| 47 | CTSH | Cognizant Technology Solutions Corp | 77.15 |
| 48 | ALB | Albemarle Corp | 77.1 |
| 49 | UNH | UnitedHealth Group Inc | 77.01 |
| 50 | AMZN | Amazon.com Inc | 76.76 |
Source: Portfolio123; data as of May 4, 2019.
Among all companies above (the ones that Wall Street is most bullish on), it would be a pretty rare case to earn a high "Quality Score."
Urbem Street Bullish Index
Now here comes the fun and crucial part: the backtest. To do it, the following index formation methodology is implemented:
- A mildly concentrated portfolio consisting of 50 U.S.-listed stocks.
- Rebalancing once every 26 weeks to include, with equal weights, the 50 stocks with the highest Street Bullish Scores.
- Excluding penny or illiquid stocks (i.e., price of less than $1 or past 20-day average volume less than 20,000) or companies covered by fewer than two analysts in terms of price target.
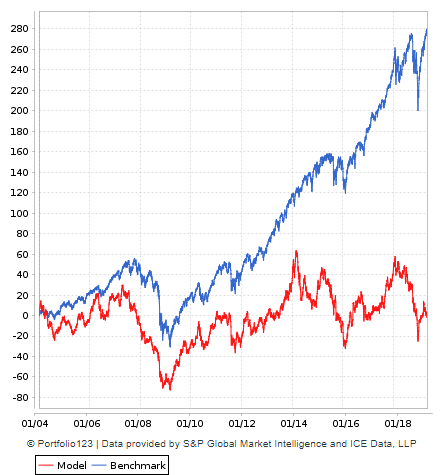
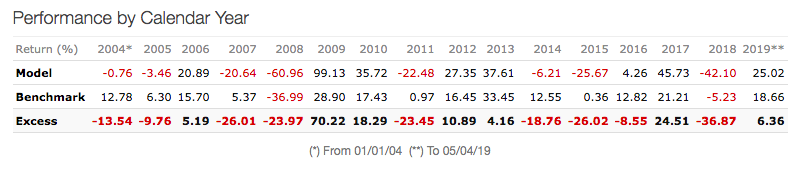
I then ran the above rules against all U.S.-listed stocks to build the Urbem Street Bullish Total Market Index. The performance looks miserable for the past 15 years (see below), annualizing at only 1.02%. The annual turnover is 144.13%, and the max drawdown is -78.94% (vs. -55.24% for the benchmark). Between 2004 and 2018, there were only six out of 15 years when the Street Bullish Index outperformed and the analyst price targets provided value on average for investors.
Please note that no trading cost or management fee is included in the performance, which is not the case for the benchmark, Vanguard Total Stock Market ETF VTI.
Source: Portfolio123; data as of 5/6/2019.
Source: Portfolio123; data as of 5/6/2019.
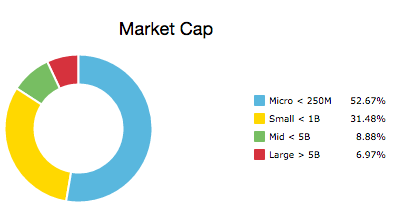
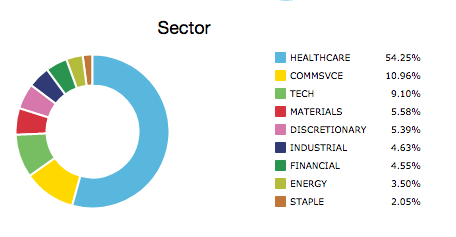
To break it down (as seen below), the current majority of the stocks in the index are small and micro companies, while the health care sector has a share of more than 50%.
Source: Portfolio123; data as of 5/6/2019.
Source: Portfolio123; data as of 5/6/2019.
With the same mechanism, I also built this Urbem Street Bullish US Large-Cap Index to backtest against the S&P 500 universe with more (and hopefully higher-quality) Wall Street coverage there.
While the absolute performance is better, the Street Bullish Index still could not beat the benchmark, SPDR S&P 500 ETF SPY. The annual turnover (137.18%) and max drawdown (-72.53%) are both slightly lower than the total market index.
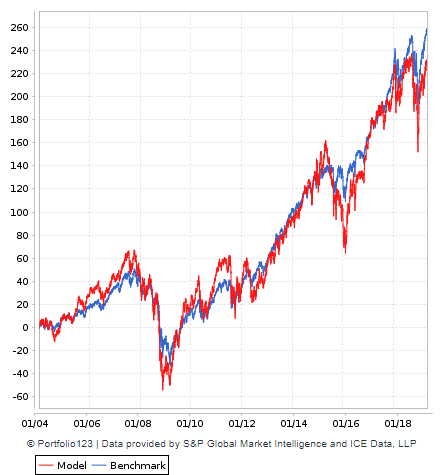

Source: Portfolio123; data as of May 6, 2019.
Still, as indicated below, there were only six out of 15 years when the Street Bullish Index managed to beat.
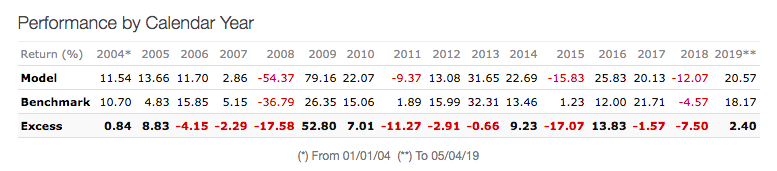 Source: Portfolio123; data as of May 6, 2019.
At the moment, the Street Bullish Large-Cap Index overweighs energy, tech and financial (see below), compared to its total market counterpart.

Source: Portfolio123; data as of May 6, 2019.
Limitation
Like all other quantitative methodologies, backtesting has its limitations. The main one, in our case (to test the value-add of analysts price targets), is due to it being backward-looking. A backtest purely considers the evidence from the past, but market dynamics could change in the future. For example, it could be the case that Wall Street analysts in aggregate would, with the help of technologies, improve their results (especially regarding currently under-covered stocks), which are not reflected enough in the market, creating some market inefficiencies (although I do not see this coming very soon).
Summary
At least for the past 15 years, a strategy built based on Wall Street analysts' recommendations would have performed poorly compared to a buy-and-hold, passive-investing approach. Even worse, the strategy would very likely cause more drawdown as part of the downside risk.
One prevailing explanation for this is that Wall Street is relatively shortsighted, while the stock market, being a voting machine for the short run and filled with highly competent players, is quite efficient. The price "guessing game" could be another example demonstrating that "competition is for losers."
It would be a wise approach for investors to stay away from the "noise" on the Street and stay focused on the long-term fundamentals of businesses.
Read more here:
Secular Growth: The Ultimate Reinvestment Opportunity
The True Competitive Advantages of Berkshire Hathaway
Not a Premium Member of GuruFocus? Sign up for a free 7-day trial here.