


On April 16, 2026, Silvercorp Metals Inc SVM announced a significant drop in silver output for the fourth quarter, reporting a production of 1.5 million ounces, which reflects an 11% decline year-over-year. The company's silver equivalent production, which includes both silver and gold, totaled 1.6 million ounces, marking a 17% decrease compared to the 1.9 million ounces produced in the same quarter of the previous fiscal year.
- Market Cap: $2.78 billion
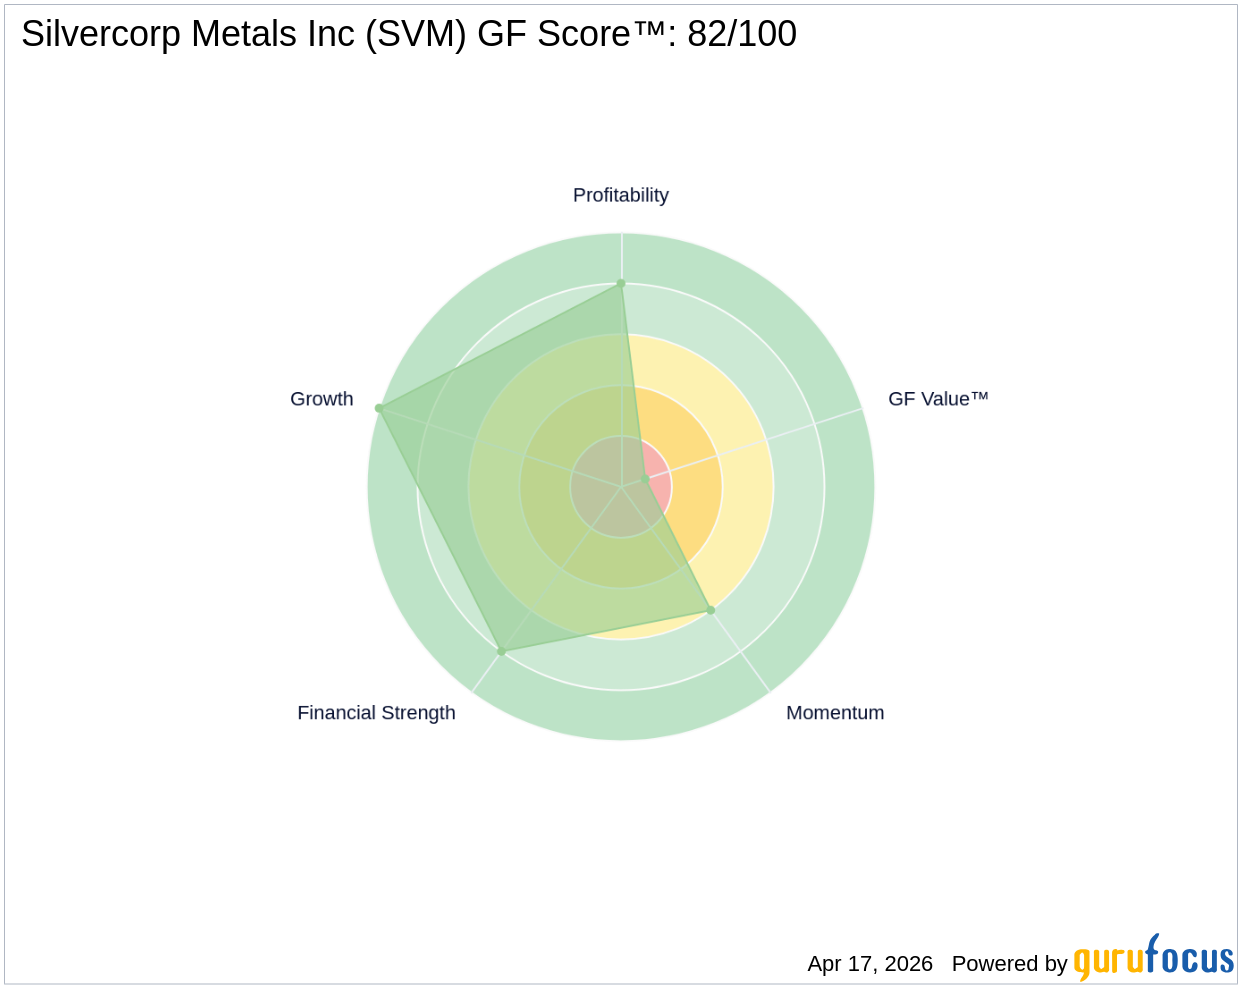
- GF Score™: 82/100, indicating strong overall performance
- Financial Strength: 8/10, reflecting a solid balance sheet
What's Behind the News?
The reported decline in silver output is concerning for investors as it suggests potential challenges in production efficiency and market demand. Silvercorp Metals Inc operates primarily in the mining sector, focusing on the acquisition, exploration, development, and operation of mines in China. The company has positioned itself as one of the main producers of silver, lead, and zinc in the region, and its recent production figures may raise questions about its operational capabilities moving forward.
With a market capitalization of approximately $2.78 billion, Silvercorp is a notable player in the basic materials sector. The company has also been expanding its operations globally, having recently acquired mining projects in Ecuador and Kyrgyzstan, which could diversify its production portfolio and mitigate risks associated with its primary operations in China.
How Is SVM Valued?
Currently, GF Value™ data is not available for Silvercorp Metals Inc. However, the company's P/E ratio is not applicable as it reported a negative earnings per share (EPS) of -0.09. This indicates that the stock may be viewed as less favorable in terms of traditional valuation metrics. Investors may want to consider other factors such as the company's growth potential and operational efficiency when assessing its value. For more detailed information, visit the SVM stock page.
What Does SVM's GF Score™ Tell Us?
The GF Score™ ranks stocks from 0 to 100 based on five key aspects: Financial Strength, Profitability, Growth, Valuation, and Momentum. Stocks with higher GF Score™ values have been found to generate higher long-term returns (backtested 2006-2021).
| Metric | Rating |
|---|---|
| GF Score™ | 82 |
| Financial Strength | 8/10 |
| Profitability | 8/10 |
| Growth | 10/10 |
Silvercorp's strengths lie in its financial stability and growth potential, as indicated by its high GF Score™ and strong rankings in financial strength and growth. However, the company's profitability rank of 8/10 suggests that while it is financially robust, it faces challenges in generating consistent profits, as evidenced by its negative net margin of -4.7%. For further insights, visit the SVM stock page.
What Are Insiders Doing with SVM Stock?
There has been no insider buying or selling activity reported in the past 12 months, indicating a lack of insider confidence or activity in the stock. This could be interpreted as a neutral signal for potential investors.
What This Means for Investors
The recent production decline raises concerns about Silvercorp's operational efficiency and market demand for its products. However, the company's strong GF Score™ and financial strength suggest that it has a solid foundation to navigate these challenges. Investors should monitor upcoming earnings reports and production updates closely to gauge the company's recovery trajectory. For the complete analysis, visit the SVM stock page. You can also use the GuruFocus Stock Screener to find similar opportunities.
Frequently Asked Questions
What is SVM's GF Score™?
SVM's GF Score™ is 82/100, indicating strong overall performance based on financial strength, profitability, and growth metrics.
How is SVM valued?
Silvercorp's valuation is challenging to assess due to its negative EPS, and traditional P/E ratios are not applicable. Investors may need to consider growth potential and operational efficiency instead.
What is SVM's P/E ratio compared to historical?
Currently, SVM does not have a P/E ratio due to negative earnings, which suggests that the company is facing profitability challenges despite its strong financial position.
This stock alert was generated using automated technology and GuruFocus financial data to provide readers with timely and accurate market reporting. This content was reviewed by GuruFocus editorial team prior to publication. Please send any questions or comments about this story to [email protected].

