


On April 21, 2026, FMC Corp (NYSE: FMC) experienced a notable decrease, with shares dropping by 5.5%, equivalent to a loss of 95 cents, bringing the stock price down to $16.40. This decline reflects current market conditions affecting the company, prompting investor attention regarding future performance and potential recovery strategies.
- Market Cap: $2.03 billion
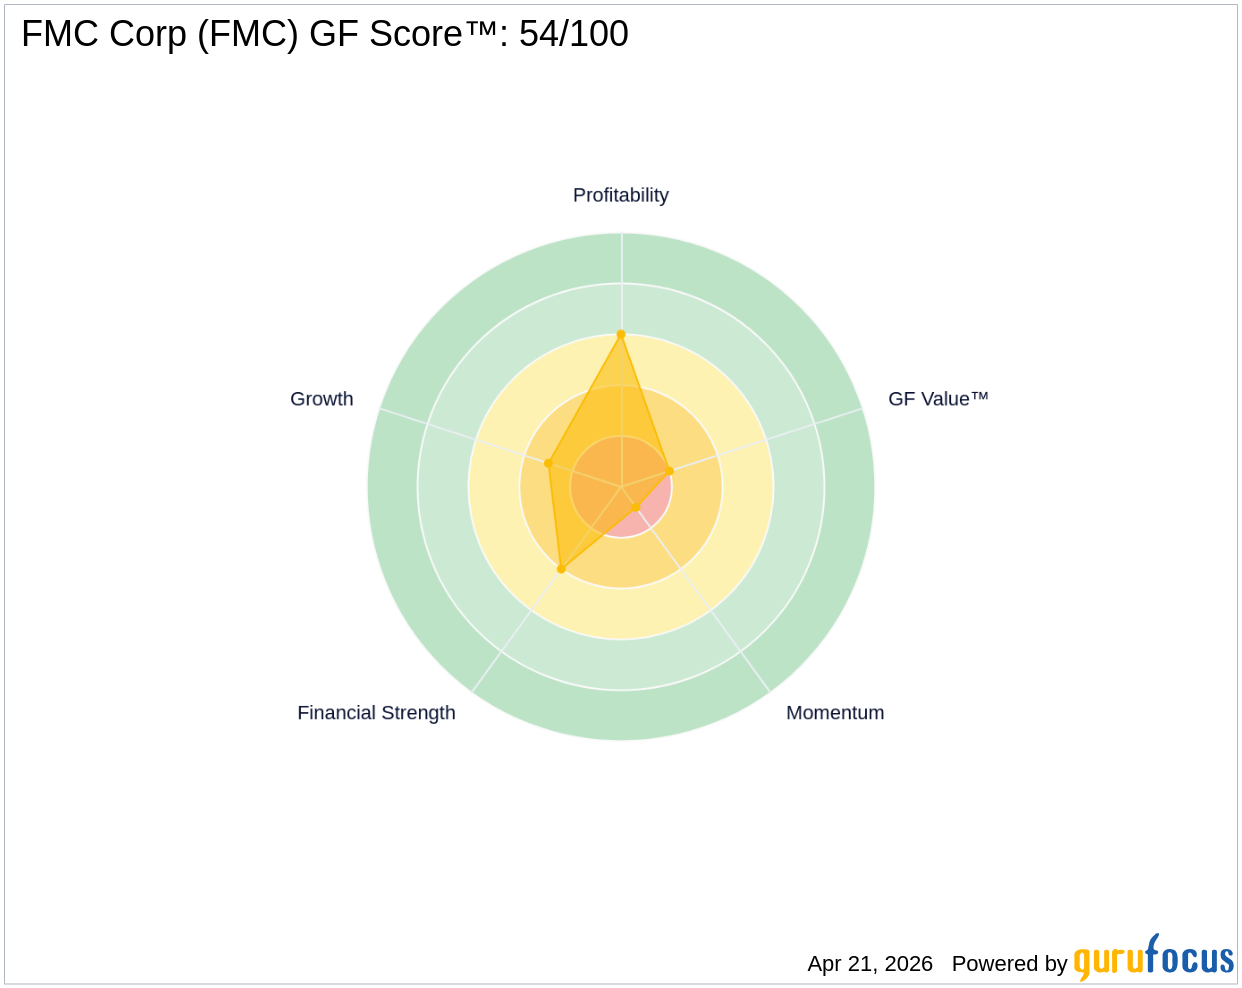
- GF Score™: 54/100, indicating average performance relative to peers.
- Insider Activity: There was 1 insider buying transaction over the past 3 months, with a total of 18,072 shares bought.
What's Behind the News?
The recent drop in FMC's stock price is significant as it highlights the ongoing challenges the company faces in the current market environment. Investors are particularly concerned about FMC's ability to navigate these challenges and implement effective recovery strategies. The decline in share price may also reflect broader trends in the agriculture sector, which has been under pressure due to various economic factors.
FMC Corp is a pure-play global crop protection company, recognized as one of the five largest patented crop protection companies. The company operates in the Basic Materials sector, specifically within the Agriculture industry, and has a market capitalization of approximately $2.03 billion. FMC's diversified product portfolio and focus on research and development of new products, including biologicals, position it as a key player in the agricultural solutions market.
How Is FMC Valued?
Currently, GF Value™ data is not available for FMC stock. However, the company's P/E ratio is not applicable as it has reported negative earnings. Instead, we can look at the price-to-sales (P/S) ratio, which stands at 0.59, indicating that the stock is trading at a discount relative to its sales. This may suggest potential undervaluation, but investors should proceed with caution given the overall financial health of the company. For more details, visit the FMC stock page.
What Does FMC's GF Score™ Tell Us?
The GF Score™ ranks stocks from 0 to 100 based on five key aspects: Financial Strength, Profitability, Growth, Valuation, and Momentum. Stocks with higher GF Score™ values have been found to generate higher long-term returns (backtested 2006-2021).
| Metric | Rating |
|---|---|
| GF Score™ | 54 |
| Financial Strength | 4/10 |
| Profitability | 6/10 |
| Growth | 3/10 |
FMC's GF Score™ of 54 indicates that it is performing at an average level compared to its peers. The financial strength rating of 4/10 suggests that the company is facing challenges, particularly with a high debt-to-equity ratio of 2.03. The profitability rank of 6/10 reflects some operational efficiency, but the growth rank of 3/10 indicates that the company has struggled to achieve consistent revenue growth. For further insights, visit the FMC stock page.
What Are Insiders Doing with FMC Stock?
In the past three months, there has been 1 insider buying transaction, with a total of 18,072 shares purchased. This insider activity may signal confidence in the company's future prospects, although it is essential to consider the broader financial context when interpreting these transactions.
What This Means for Investors
FMC's recent stock performance and financial metrics suggest a complex situation for investors. While the insider buying may indicate some level of confidence, the company's low GF Score™, high debt levels, and declining profitability raise concerns about its long-term viability. Investors should carefully assess these factors before making any decisions. For the complete analysis, visit the FMC stock page. You can also use the GuruFocus Stock Screener to find similar opportunities.
Frequently Asked Questions
What is FMC's GF Score™?
FMC's GF Score™ is 54/100, indicating average performance compared to its peers.
How is FMC valued?
FMC's P/S ratio is 0.59, suggesting it may be undervalued relative to its sales, but caution is advised due to negative earnings.
What is FMC's P/E ratio compared to historical?
FMC does not have a P/E ratio available due to negative earnings, which raises concerns about its financial strength and operational efficiency.
This stock alert was generated using automated technology and GuruFocus financial data to provide readers with timely and accurate market reporting. This content was reviewed by GuruFocus editorial team prior to publication. Please send any questions or comments about this story to [email protected].

