


On April 22, 2026, Preferred Bank PFBC announced its first quarter financial results, revealing a book value of $65.04 per share and a Common Equity Tier 1 (CET1) capital ratio of 10.87%. The company's net income for the quarter ending March 31, 2026, amounted to $31.1 million, translating to $2.53 per diluted share. This figure reflects a decline from the previous quarter, where net income stood at $34.8 million or $2.79 per diluted share.
- P/E (TTM): 9.03x, indicating a potentially undervalued stock compared to historical averages.
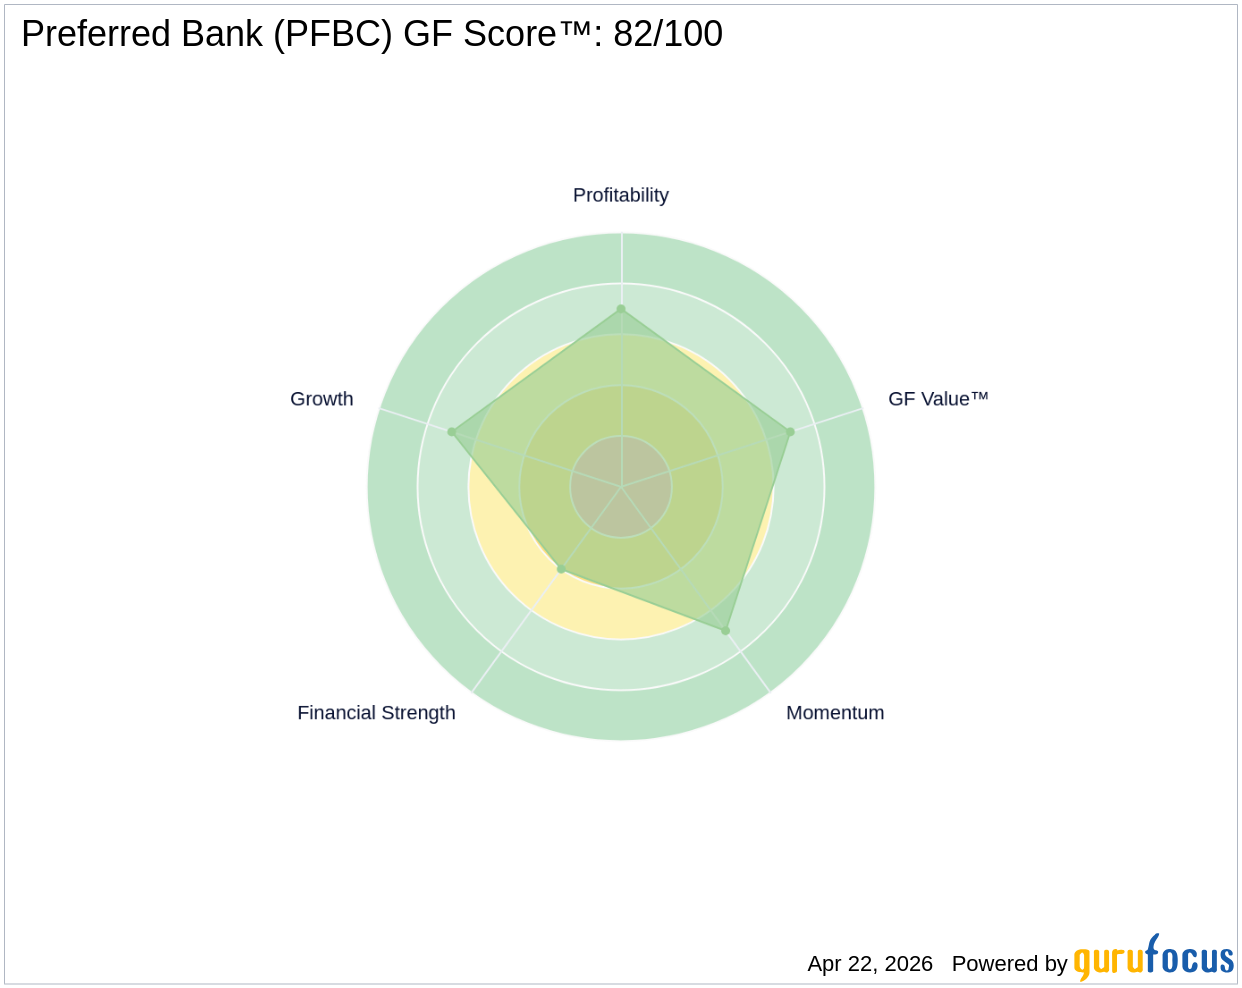
- GF Score™: 82/100, suggesting a strong overall performance relative to peers.
- Financial Strength: 4/10, indicating moderate financial stability.
What's Behind the News?
The recent announcement from Preferred Bank highlights a notable decline in net income, primarily driven by the Federal Reserve's interest rate cuts and the impact of a significant customer account categorized as nonaccrual. This situation has led to a reversal of interest income, reflecting the challenges faced by the bank in the current economic environment. The decline in income is significant as it may influence investor sentiment and the bank's future performance.
Preferred Bank operates in the financial services sector, specifically within the banking industry. The bank is headquartered in California and offers a range of services including personal banking, business banking, and commercial banking. With a market capitalization of approximately $1.14 billion and a focus on personalized deposit services and loans for small to mid-sized businesses, Preferred Bank plays a crucial role in supporting local economies.
How Is PFBC Valued?
While GF Value™ data is not available for Preferred Bank, the current P/E ratio stands at 9.03x. This valuation metric suggests that the stock may be undervalued when compared to its historical averages, as the 5-year median P/E is not specified. Investors often look for P/E ratios that are lower than the historical averages of the sector to identify potential buying opportunities. For more detailed information, visit the PFBC stock page.
What Does PFBC's GF Score™ Tell Us?
The GF Score™ ranks stocks from 0 to 100 based on five key aspects: Financial Strength, Profitability, Growth, Valuation, and Momentum. Stocks with higher GF Score™ values have been found to generate higher long-term returns (backtested 2006-2021).
| GF Score™ | 82 |
| Financial Strength | 4/10 |
| Profitability | 7/10 |
| Growth | 7/10 |
| Valuation | Fairly Valued |
Preferred Bank's strengths lie in its profitability and growth ranks, both rated at 7/10, indicating a solid performance in generating earnings and expanding its operations. However, the financial strength score of 4/10 suggests that while the bank is stable, there are areas that may require improvement. Overall, the GF Score™ of 82/100 reflects a strong position relative to its peers. For more details, visit the PFBC stock page.
What Are Insiders Doing with PFBC Stock?
There has been no insider buying or selling activity reported in the last three months or the last twelve months, indicating that insiders may be holding their positions during this period of uncertainty.
What This Means for Investors
Given the recent decline in net income and the overall economic challenges, investors should approach Preferred Bank with caution. However, the strong GF Score™ and relatively low P/E ratio suggest that the stock could be an attractive option for those looking for potential value in the financial sector. For the complete analysis, visit the PFBC stock page. You can also use the GuruFocus Stock Screener to find similar opportunities.
Frequently Asked Questions
What is PFBC's GF Score™?
PFBC's GF Score™ is 82/100, indicating a strong overall performance relative to its peers and suggesting potential for long-term returns.
How is PFBC valued?
PFBC is currently valued with a P/E ratio of 9.03x, which may indicate that the stock is undervalued compared to historical averages.
What is PFBC's P/E ratio compared to historical?
PFBC's P/E ratio of 9.03x suggests that it is potentially undervalued, especially when considering that the 5-year median P/E is not specified.
This stock alert was generated using automated technology and GuruFocus financial data to provide readers with timely and accurate market reporting. This content was reviewed by GuruFocus editorial team prior to publication. Please send any questions or comments about this story to [email protected].

