

On May 19, 2026, Eagle Point Income Co Inc EIC reported a decline in its net asset value per common share, which stood at $11.99 as of March 31, 2026, down from $13.31 recorded on December 31, 2025. The company's Chairman and CEO, Thomas P. Majewski, expressed confidence in the investment portfolio's ability to generate strong cash flows, with net investment income exceeding distributions to common stockholders.
- Market Cap: $246.34 million
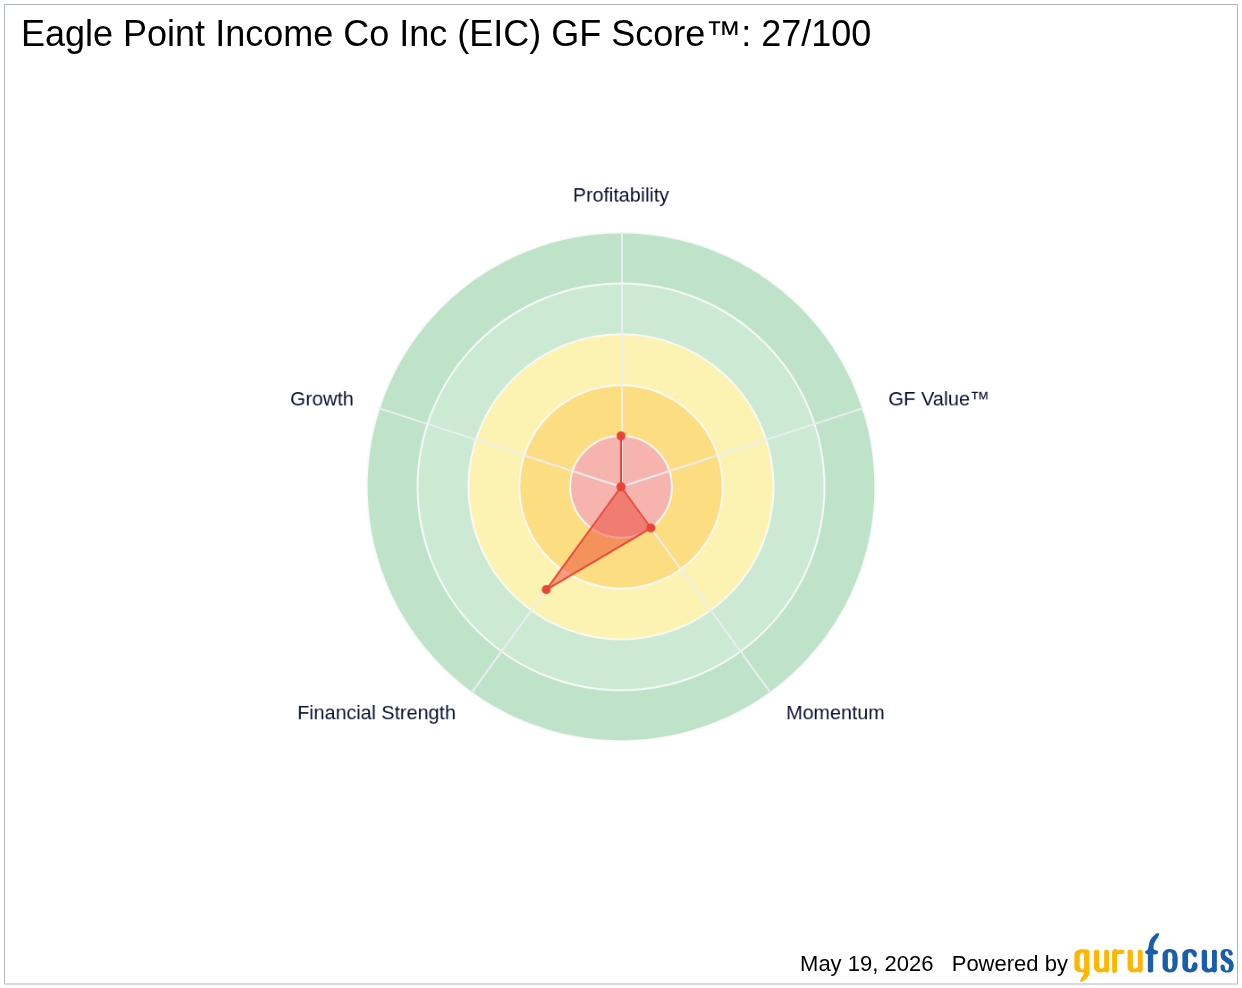
- GF Score™: 27/100, indicating potential challenges in financial health and profitability
- Insider Activity: No insider buy or sell activity reported in the last 12 months
What's Behind the News?
The recent announcement regarding Eagle Point Income Co Inc's net asset value reflects a notable decrease, which could raise concerns among investors. However, Majewski's remarks about the strong cash flows and the potential for increased income from the floating-rate CLO debt portfolio amid anticipated interest rate hikes provide a glimmer of optimism. This suggests that while the current valuation may be under pressure, there are elements within the business that could support future growth.
Eagle Point Income Co Inc operates within the Financial Services sector, specifically in the Asset Management industry. The company primarily focuses on generating high current income through investments in junior debt tranches of collateralized loan obligations (CLOs). With a market capitalization of approximately $246.34 million, EIC is positioned to capitalize on its specialized investment strategy, which targets below-investment grade U.S. senior secured loans across diverse industry sectors.
How Is EIC Valued?
Currently, GF Value™ data is not available for Eagle Point Income Co Inc. However, the company's valuation can be assessed through its price-to-sales (P/S) ratio, which stands at an elevated 107.98. This high P/S ratio indicates that the stock may be significantly overvalued compared to its sales, especially when considering the historical context. The company's price is currently $10.6899, which is below its target price of $12.13, suggesting a potential upside if the company can improve its financial performance. For more detailed information, visit the EIC stock page.
What Does EIC's GF Score™ Tell Us?
The GF Score™ ranks stocks from 0 to 100 based on five key aspects: Financial Strength, Profitability, Growth, Valuation, and Momentum. Stocks with higher GF Score™ values have been found to generate higher long-term returns (backtested 2006-2021).
| Metric | Rating |
|---|---|
| GF Score™ | 27 |
| Financial Strength | 5/10 |
| Profitability | 2/10 |
EIC's GF Score™ of 27 indicates significant challenges, particularly in profitability, where it ranks only 2 out of 10. The financial strength rating of 5 suggests that while the company has some stability, it may not be robust enough to withstand adverse market conditions. Investors should be cautious, as the low profitability rank highlights potential operational inefficiencies. For further insights, visit the EIC stock page.
What Are Insiders Doing with EIC Stock?
There has been no reported insider buying or selling activity for Eagle Point Income Co Inc in the last 12 months, indicating a lack of insider confidence or engagement in the stock at this time.
What This Means for Investors
Given the current valuation metrics and the company's low GF Score™, investors may want to approach Eagle Point Income Co Inc with caution. The significant drop in net asset value, coupled with the high P/S ratio and low profitability, suggests that the stock may face challenges ahead. However, the potential for increased income from the CLO portfolio could provide a catalyst for future growth. For the complete analysis, visit the EIC stock page. You can also use the GuruFocus Stock Screener to find similar opportunities.
Frequently Asked Questions
What is EIC's GF Score™?
EIC's GF Score™ is 27 out of 100, indicating potential challenges in financial health and profitability.
How is EIC valued?
EIC's valuation is assessed through a high P/S ratio of 107.98, suggesting it may be significantly overvalued compared to its sales.
What is EIC's P/E ratio compared to historical?
EIC does not have a P/E ratio available, but its financial strength is rated at 5 out of 10, indicating some stability.
This stock alert was generated using automated technology and GuruFocus financial data to provide readers with timely and accurate market reporting. This content was reviewed by GuruFocus editorial team prior to publication. Please send any questions or comments about this story to [email protected].

