


On June 01, 2026, as SpaceX prepares for a highly anticipated IPO, the aerospace sector is gaining significant attention. Analysts suggest that companies like Intuitive Machines INTU and Redwire may present undervalued investment opportunities.
- GF Value™ verdict: Current Price $331.53 vs GF Value™ $803.17 = 58.7% undervalued
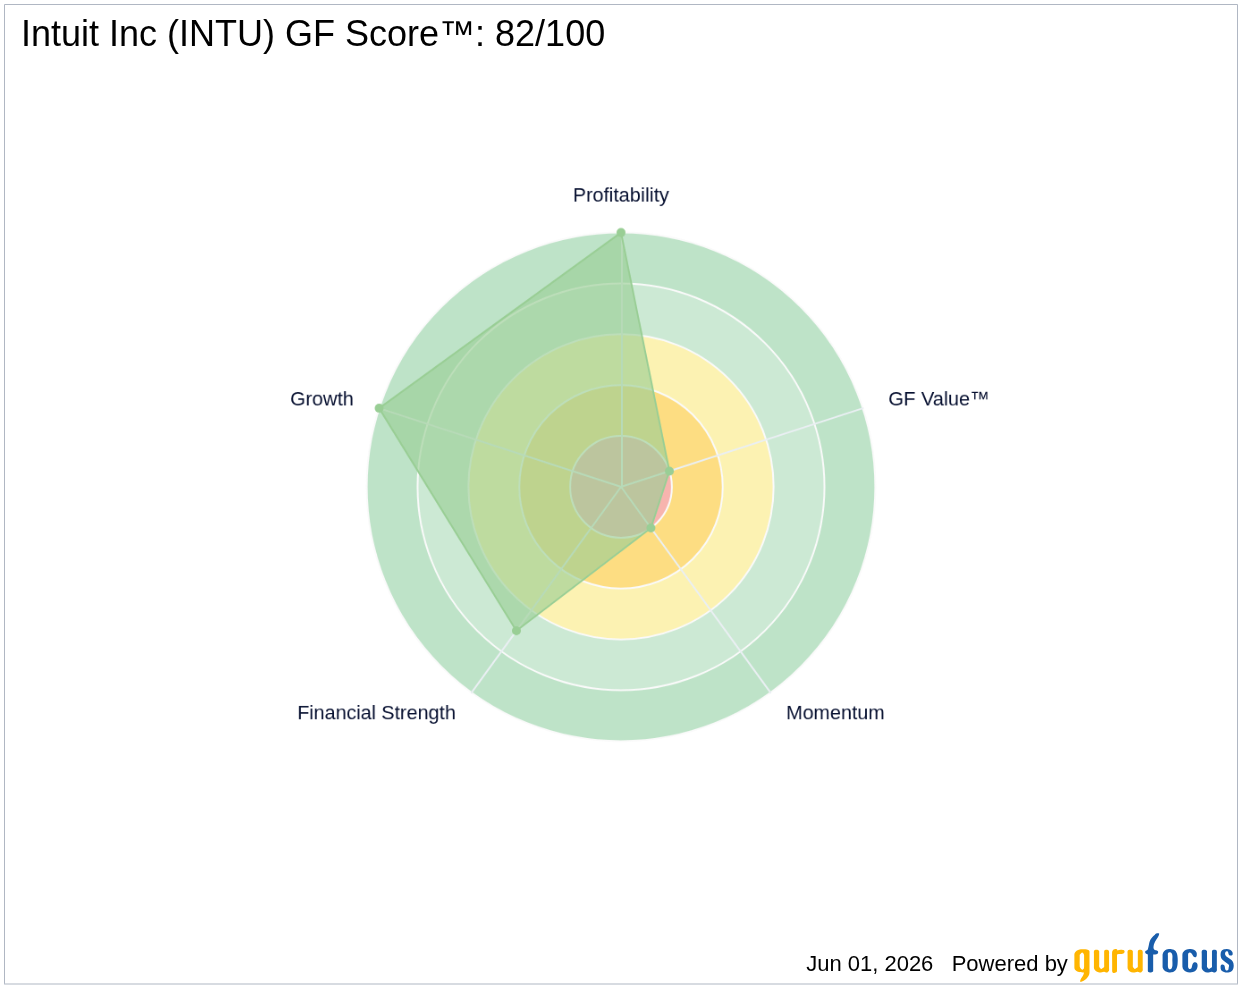
- GF Score™: 82/100, indicating strong financial health and growth potential
- Key financial signal: P/E (TTM) of 20.08x compared to a 5-year median P/E of 59.33x
What's Behind the News?
The aerospace sector is experiencing a surge in interest as companies gear up for significant advancements in space exploration and technology. With SpaceX's upcoming IPO, investors are looking closely at other players in the market, particularly Intuitive Machines, which specializes in commercial lunar services. The company has recently secured numerous contracts, resulting in a substantial backlog of $1.1 billion. This positions it well for future growth as the demand for lunar exploration increases.
Intuitive Machines operates in the aerospace sector, focusing on lunar landing and exploration technologies. With a market capitalization of approximately $90.7 billion, the company is a leader in its field, providing innovative solutions that cater to both commercial and governmental needs. The first quarter of 2026 saw the company report revenues of $186.7 million, nearly tripling from the previous year, with annual revenue guidance set between $900 million and $1 billion, indicating robust growth potential.
Is INTU Overvalued or Undervalued?
According to GuruFocus, the GF Value™ for Intuitive Machines is $803.17, while the current price stands at $331.53, indicating that the stock is significantly undervalued by 58.7%. This substantial margin of safety suggests that investors may have an opportunity to acquire shares at a price well below their intrinsic value. The P/E (TTM) ratio of 20.08x is notably lower than the 5-year median P/E of 59.33x, further reinforcing the notion that the stock is undervalued. For more details, visit the GF Value™ page.
What Does INTU's GF Score™ Tell Us?
The GF Score™ ranks stocks from 0 to 100 based on five key aspects: Financial Strength, Profitability, Growth, Valuation, and Momentum. Stocks with higher GF Score™ values have been found to generate higher long-term returns (backtested 2006-2021).
| Metric | Rating |
|---|---|
| GF Score™ | 82 |
| Financial Strength | 7/10 |
| Profitability | 10/10 |
| Growth | 10/10 |
| Valuation | 2/10 |
| Momentum | 2/10 |
Intuitive Machines shows strong strengths in profitability and growth, both ranking at 10/10, indicating a solid foundation for future performance. However, the valuation and momentum ranks are lower, suggesting that while the company is fundamentally sound, it may face challenges in market perception and price momentum.
For further insights, visit the INTU stock page.
What Are Insiders Doing with INTU Stock?
In the past three months, insider activity has shown a balanced approach with $541,660 in insider buys and $457,043 in insider sells, indicating that insiders are actively managing their positions in the company.
What This Means for Investors
Given the significant undervaluation indicated by the GF Value™ and the strong GF Score™, Intuitive Machines presents an intriguing opportunity for investors looking at the aerospace sector. The company's robust growth in revenues and substantial backlog further support its potential for long-term success. For the complete analysis, visit the INTU stock page. You can also use the GuruFocus Stock Screener to find similar opportunities.
Frequently Asked Questions
What is INTU's GF Score™?
INTU's GF Score™ is 82/100, indicating strong financial health and growth potential.
Is INTU overvalued or undervalued?
INTU is significantly undervalued, with a current price of $331.53 compared to a GF Value™ of $803.17, representing a 58.7% undervaluation.
What is INTU's P/E ratio compared to historical?
INTU's P/E (TTM) ratio is 20.08x, which is considerably lower than its 5-year median P/E of 59.33x, suggesting that the stock is undervalued relative to its historical performance.
This stock alert was generated using automated technology and GuruFocus financial data to provide readers with timely and accurate market reporting. This content was reviewed by GuruFocus editorial team prior to publication. Please send any questions or comments about this story to [email protected].

