


On June 01, 2026, a recent analysis by GuruFocus revealed the intrinsic value of Thermo Fisher Scientific TMO is estimated at $477.60 per share based on a discounted cash flow (DCF) model. With the current stock price around $494.15, the analysis concludes that the stock is reasonably valued, with a slight margin of safety at -3.1%.
- GF Value™ verdict: Current Price $494.15 vs GF Value™ $579.58 = 14.7% undervalued
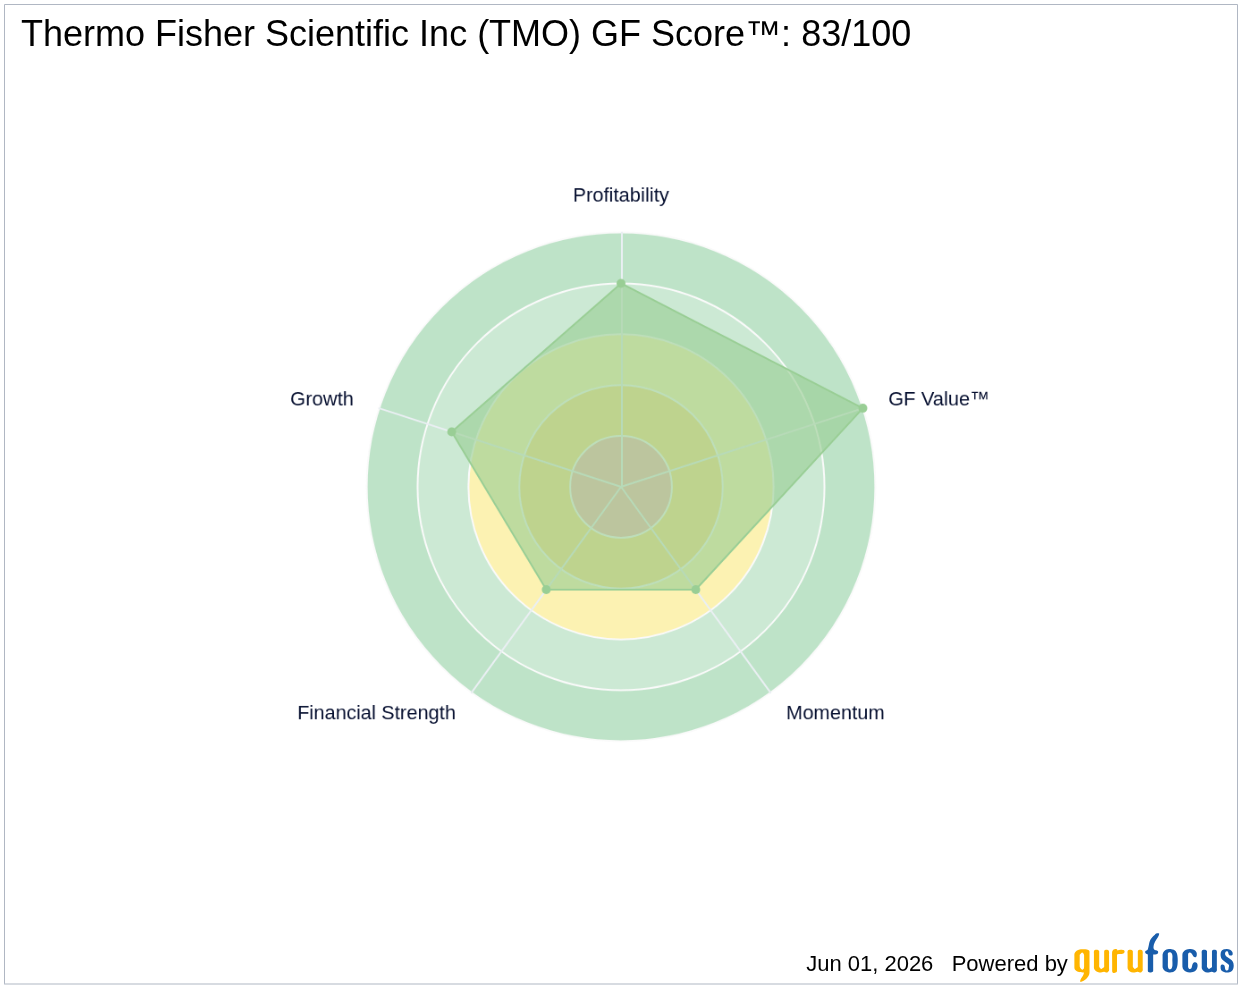
- GF Score™ 83/100, indicating strong overall performance
- Insider activity shows $8.1 million in shares sold over the last three months
What's Behind the News?
The analysis highlights the complexities surrounding Thermo Fisher Scientific's valuation, particularly in light of its recent strategic moves. The company exceeded first-quarter revenue expectations of $11.01 billion and agreed to sell its microbiology business for approximately $1.075 billion. These developments are significant as they reflect the company's operational efficiency and strategic focus on core competencies, which may influence future growth prospects.
Thermo Fisher Scientific Inc operates in the healthcare sector, specifically within the Medical Diagnostics & Research industry. The company specializes in selling scientific instruments, laboratory equipment, diagnostics consumables, and life science reagents. With a market capitalization of approximately $183.64 billion, Thermo Fisher has established itself as a leader in its field, operating through four segments: analytical technologies, specialty diagnostic products, life science solutions, and lab products and services.
Is TMO Overvalued or Undervalued?
According to the DCF model, the intrinsic value of TMO is estimated at $477.60 per share, which suggests that the stock is currently trading at a slight premium. However, the GF Value™ indicates a higher target of $579.58, suggesting that TMO is 14.7% undervalued based on this proprietary measure. The slight margin of safety at -3.1% indicates that while the stock is reasonably valued, there may be limited downside protection for investors at the current price level.
Thermo Fisher's trailing twelve months (TTM) P/E ratio stands at 27.17x, which is lower than its 5-year median P/E of 31.32x. This discrepancy suggests that the stock may be trading at a more attractive valuation compared to its historical averages. For further insights, you can explore the GF Value™.
What Does TMO's GF Score™ Tell Us?
The GF Score™ ranks stocks from 0 to 100 based on five key aspects: Financial Strength, Profitability, Growth, Valuation, and Momentum. Stocks with higher GF Score™ values have been found to generate higher long-term returns (backtested 2006-2021).
| Metric | Rating |
|---|---|
| GF Score™ | 83 |
| Financial Strength | 5/10 |
| Profitability | 8/10 |
| Growth | 7/10 |
| Valuation | 10/10 |
| Momentum | 5/10 |
The strengths of TMO lie in its profitability and valuation ranks, which are relatively high at 8/10 and 10/10 respectively. However, the financial strength and momentum ranks are lower, indicating areas where the company may need to improve. For more detailed information, visit the TMO stock page.
What Are Insiders Doing with TMO Stock?
In the past three months, insider activity has shown a significant sell-off, with $8.1 million worth of shares sold. This could indicate a lack of confidence among insiders regarding the stock's near-term performance or a strategic reallocation of their holdings.
What This Means for Investors
The analysis suggests that Thermo Fisher Scientific is currently modestly undervalued according to the GF Value™, with a strong GF Score™ indicating solid overall performance. However, the recent insider selling may raise some caution for potential investors.
For the complete analysis, visit the TMO stock page. You can also use the GuruFocus Stock Screener to find similar opportunities.
Frequently Asked Questions
What is TMO's GF Score™?
TMO's GF Score™ is 83/100, indicating strong overall performance based on various financial metrics.
Is TMO overvalued or undervalued?
According to the GF Value™, TMO is currently 14.7% undervalued, with a target intrinsic value of $579.58 compared to the current price of $494.15.
What is TMO's P/E ratio compared to historical?
TMO's current P/E ratio is 27.17x, which is lower than its 5-year median P/E of 31.32x, suggesting a more attractive valuation compared to its historical averages.
This stock alert was generated using automated technology and GuruFocus financial data to provide readers with timely and accurate market reporting. This content was reviewed by GuruFocus editorial team prior to publication. Please send any questions or comments about this story to [email protected].

