


On June 03, 2026, shares of Blackstone Inc BX experienced a decline of 5.5%, reflecting a broader downturn in the asset management sector. This decline coincided with reports indicating challenges faced by the $31 billion Cliffwater Corporate Lending Fund. The fund communicated to its investors that only around one-third of their withdrawal requests would be fulfilled, while its primary private credit fund limited redemptions to 5% for the second quarter, amid investor demands for roughly 17% of shares.
- Blackstone's market cap stands at approximately $135.61 billion.
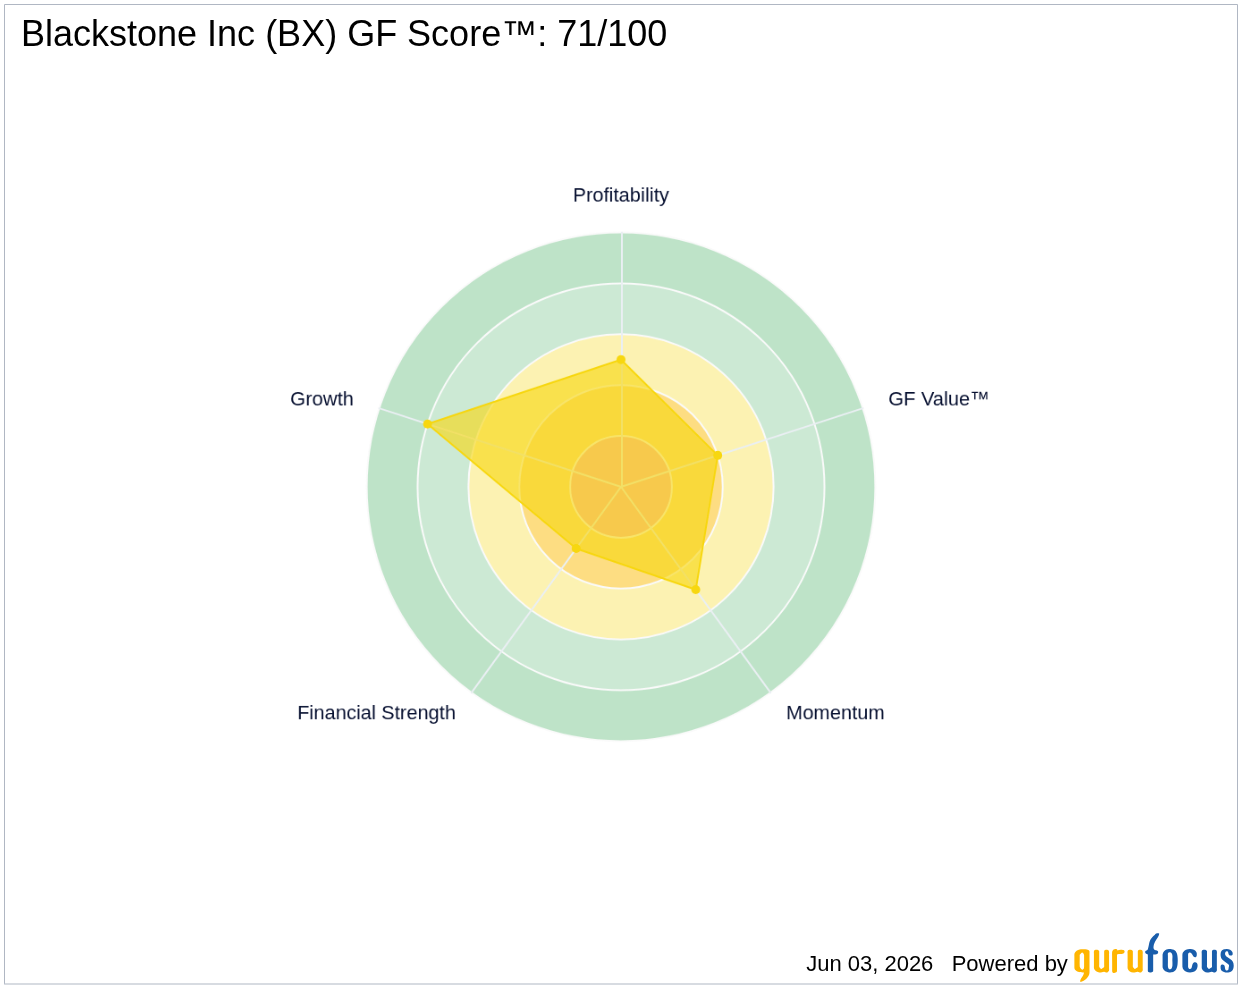
- GF Score™: 71/100, indicating a solid overall performance relative to peers.
- Insider activity shows a net sell of $3.8 million over the past three months.
What's Behind the News?
The recent decline in Blackstone's stock price is attributed to broader challenges within the asset management sector, particularly highlighted by the struggles of the Cliffwater Corporate Lending Fund. The fund's inability to fulfill withdrawal requests has raised concerns among investors, leading to a cautious outlook for Blackstone's private credit funds. Additionally, Moody's negative outlook on these funds has further compounded the situation, resulting in a significant drop in stock prices.
Blackstone Inc is the world's largest alternative-asset manager, boasting $1.304 trillion in total assets under management, including $937.6 billion in fee-earning assets as of March 2026. The company operates across various segments, including private equity, real estate, credit, and insurance, primarily serving institutional investors. With a market cap of approximately $135.61 billion, Blackstone continues to hold a significant position in the financial services sector.
How Is BX Valued?
Currently, GF Value™ data is not available for Blackstone Inc. However, the company's P/E ratio stands at 28.39, which is relatively high compared to historical averages, indicating that the stock may be valued on the higher side. Investors should consider this valuation in the context of the company's recent performance and market conditions. For more detailed information, visit the BX stock page.
What Does BX's GF Score™ Tell Us?
The GF Score™ ranks stocks from 0 to 100 based on five key aspects: Financial Strength, Profitability, Growth, Valuation, and Momentum. Stocks with higher GF Score™ values have been found to generate higher long-term returns (backtested 2006-2021).
| GF Score™ | 71 |
| Financial Strength | 3/10 |
| Profitability | 5/10 |
| Growth | 8/10 |
Blackstone's GF Score™ of 71 reflects a solid performance, particularly in growth, where it ranks 8 out of 10. However, its financial strength is rated poorly at 3 out of 10, indicating concerns regarding its debt levels. This mixed score suggests that while the company has growth potential, investors should be cautious about its financial stability. For further insights, visit the BX stock page.
What Are Insiders Doing with BX Stock?
In the past three months, insider activity has shown a net sell of $3.8 million, indicating that insiders may be cautious about the company's near-term prospects. This level of insider selling could be a signal for investors to closely monitor the company's performance and outlook.
What This Means for Investors
The recent decline in Blackstone's stock, coupled with the challenges faced by its private credit funds, raises questions about the company's short-term performance. However, its GF Score™ of 71 and strong growth rank suggest potential for long-term value. Investors should weigh these factors carefully before making decisions.
For the complete analysis, visit the BX stock page. You can also use the GuruFocus Stock Screener to find similar opportunities.
Frequently Asked Questions
What is BX's GF Score™?
BX's GF Score™ is 71, indicating a solid overall performance relative to its peers.
How is BX valued?
BX has a P/E ratio of 28.39, which suggests it may be valued on the higher side compared to historical averages.
What is BX's P/E ratio compared to historical?
BX's current P/E ratio of 28.39 is relatively high, suggesting that the stock may be overvalued in the current market context.
This stock alert was generated using automated technology and GuruFocus financial data to provide readers with timely and accurate market reporting. This content was reviewed by GuruFocus editorial team prior to publication. Please send any questions or comments about this story to [email protected].

