


On June 03, 2026, Costco Wholesale Corp COST released its Q3 2026 earnings report, showcasing impressive financial results. The company achieved total revenue of $70.53 billion, marking an 11.6% year-over-year increase and surpassing market expectations. Here are some key highlights:
- GF Value™ verdict: Current Price $959.24 vs GF Value™ $999.19, indicating a 4.0% undervaluation.
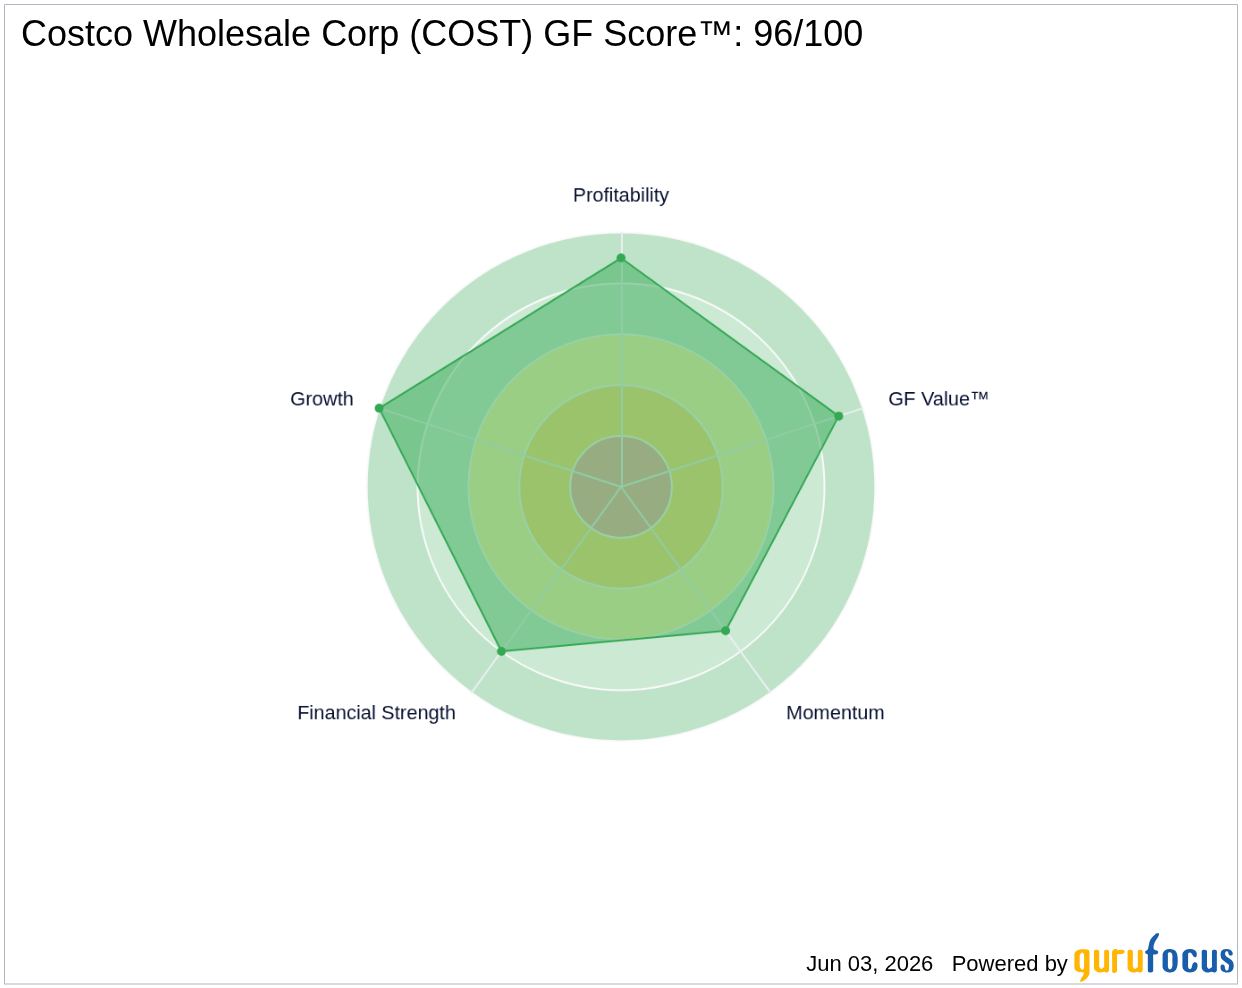
- GF Score™: 96/100, reflecting strong overall performance across multiple metrics.
- Financial Strength: Ranked 8/10, indicating a solid balance sheet and financial health.
What's Behind the News?
Costco's recent earnings report revealed a total revenue of $70.53 billion, which includes membership fees and represents an 11.6% increase compared to the same quarter last year. The net profit reached $2.19 billion, translating to earnings per share of $4.93. Comparable store sales grew by 9.8%, significantly up from 7.4% in the previous quarter. The U.S. market saw a growth of 9.4%, while international markets grew by 11.2%. Membership fee income also rose by 10.7% to $1.37 billion, maintaining a near 90% renewal rate globally.
Despite these strong figures, Costco's stock faced pressure post-earnings due to margin pressures from record gasoline sales and some missed membership growth targets. Analysts have expressed caution regarding the company's high valuation, with a dynamic P/E ratio around 51 and a forward P/E of approximately 46. Firms like Guggenheim and DA Davidson have opted to maintain a "hold" rating, citing limited upside potential despite Costco's robust business model.
Is COST Overvalued or Undervalued?
According to GuruFocus, Costco's GF Value™ is calculated at $999.19, while the current stock price is $959.24, indicating that the stock is 4.0% undervalued. This margin of safety suggests that investors might find a favorable entry point at current prices. The trailing P/E ratio (TTM) stands at 49.88x, which is higher than the 5-year median P/E of 46.57x, indicating that the stock may be trading at a premium compared to its historical valuations. For more details, visit the GF Value™ page.
What Does COST's GF Score™ Tell Us?
The GF Score™ ranks stocks from 0 to 100 based on five key aspects: Financial Strength, Profitability, Growth, Valuation, and Momentum. Stocks with higher GF Score™ values have been found to generate higher long-term returns (backtested 2006-2021).
| Metric | Rating |
|---|---|
| GF Score™ | 96 |
| Financial Strength | 8/10 |
| Profitability | 9/10 |
| Growth | 10/10 |
| Valuation | 9/10 |
| Momentum | 7/10 |
Costco's strengths lie in its high growth and profitability ranks, which are both at the top of the scale. However, the momentum rank of 7/10 indicates that while the stock has performed well, there may be some volatility ahead. For more information, visit the COST stock page.
What Are Insiders Doing with COST Stock?
In the last three months, insider activity has shown a sell value of $1.4 million, with no reported insider purchases. This could indicate a cautious sentiment among insiders regarding the stock's future performance.
What This Means for Investors
Overall, Costco's strong financial performance is reflected in its high GF Score™ and solid growth metrics. However, the stock's current valuation and insider selling may raise concerns for potential investors. For the complete analysis, visit the COST stock page. You can also use the GuruFocus Stock Screener to find similar opportunities.
Frequently Asked Questions
What is COST's GF Score™?
COST's GF Score™ is 96/100, indicating strong performance across multiple financial metrics.
Is COST overvalued or undervalued?
COST is currently undervalued by 4.0% according to GF Value™, with a fair value of $999.19 compared to the current price of $959.24.
What is COST's P/E ratio compared to historical?
COST's trailing P/E ratio is 49.88x, which is higher than its 5-year median P/E of 46.57x, suggesting a premium valuation compared to its historical performance.
This stock alert was generated using automated technology and GuruFocus financial data to provide readers with timely and accurate market reporting. This content was reviewed by GuruFocus editorial team prior to publication. Please send any questions or comments about this story to [email protected].

