


On June 09, 2026, Intercontinental Exchange ICE announced the launch of ICE Compass, an AI-driven trading analytics platform designed to enhance fixed income trading operations. This innovative tool provides buy-side desks with prioritized counterparty rankings and price forecasts before executing trades. T. Rowe Price (TROW) has become the platform's first major client. Following this announcement, ICE shares rose by 2.00% to $141.83 in pre-market trading, while TROW shares saw a slight decline of 0.41% to $105.02.
- ICE's market cap stands at approximately $78.33 billion.
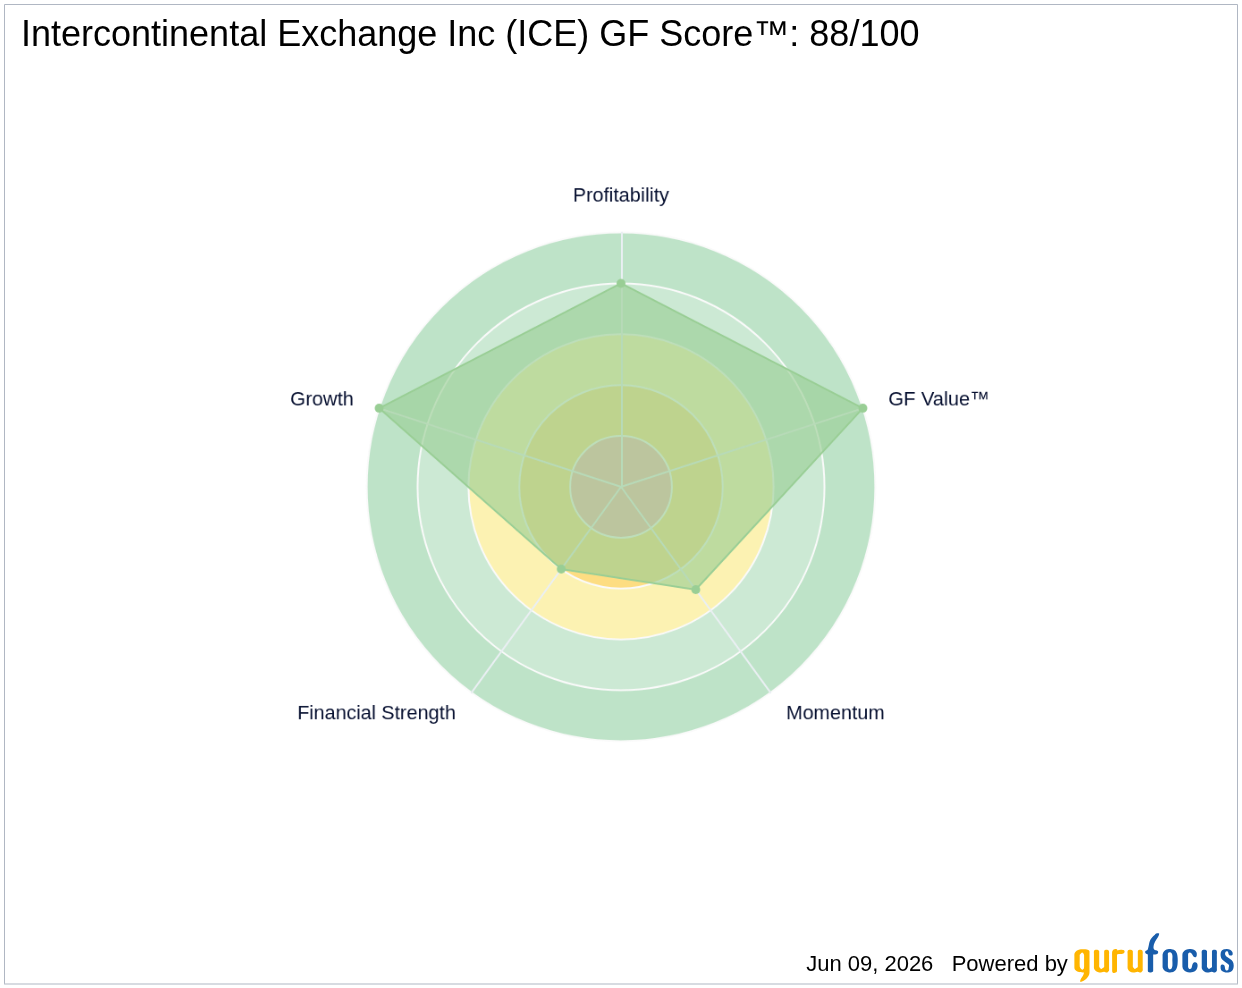
- GF Score™: 88/100, indicating strong potential for long-term returns.
- Insider activity shows $2.1 million in shares sold over the past three months, with no purchases.
What's Behind the News?
The introduction of ICE Compass marks a significant advancement in the company's offerings, particularly in the fixed income sector, which has been increasingly reliant on data-driven insights for trading decisions. The platform's capabilities are expected to streamline trading processes and improve decision-making for buy-side desks, which are crucial players in the financial markets. By leveraging AI technology, ICE aims to provide its clients with a competitive edge in an evolving trading landscape.
Intercontinental Exchange Inc operates as a vertically integrated operator of financial exchanges and provides ancillary data products. The company is best known for its ownership of the New York Stock Exchange, acquired in 2013. With a market cap of approximately $78.33 billion, ICE generates revenue from various segments, including exchanges (54% of net revenue), mortgage technology (22%), and fixed-income and data services (24%). This diversified revenue stream positions ICE well within the financial services sector.
How Is ICE Valued?
Currently, there is no GF Value™ data available for ICE. However, the company's P/E ratio stands at 20.16, which is relatively close to its historical averages. This suggests that while the stock may be trading at a reasonable valuation, investors should consider other financial metrics and market conditions before making investment decisions. For more detailed valuation insights, visit the ICE stock page.
What Does ICE's GF Score™ Tell Us?
The GF Score™ ranks stocks from 0 to 100 based on five key aspects: Financial Strength, Profitability, Growth, Valuation, and Momentum. Stocks with higher GF Score™ values have been found to generate higher long-term returns (backtested 2006-2021).
| Metric | Rating |
|---|---|
| GF Score™ | 88 |
| Financial Strength | 4/10 |
| Profitability | 8/10 |
| Growth | 10/10 |
ICE's strengths lie in its robust growth and profitability rankings, with a Growth Rank of 10/10 indicating strong revenue growth potential. However, the Financial Strength rating of 4/10 suggests some concerns regarding the company's balance sheet and overall financial health. Investors should weigh these factors carefully when considering ICE as part of their portfolio. For further details, visit the ICE stock page.
What Are Insiders Doing with ICE Stock?
Over the past three months, insider activity has shown a total of $2.1 million in shares sold, with no insider purchases reported during this period. This trend may indicate a cautious outlook among insiders regarding the company's near-term performance.
What This Means for Investors
Given ICE's strong GF Score™ of 88 and its solid growth and profitability rankings, the company appears to be well-positioned for future performance. However, the financial strength concerns and recent insider selling may warrant caution. Investors should conduct thorough research and consider their risk tolerance before making investment decisions. For the complete analysis, visit the ICE stock page. You can also use the GuruFocus Stock Screener to find similar opportunities.
Frequently Asked Questions
What is ICE's GF Score™?
ICE's GF Score™ is 88/100, indicating a strong potential for long-term returns based on its financial metrics and market performance.
How is ICE valued?
ICE's P/E ratio is currently at 20.16, which is relatively close to its historical averages, suggesting it may be reasonably valued in the current market.
What is ICE's P/E ratio compared to historical?
ICE's P/E ratio of 20.16 is close to its historical averages, indicating that the stock is trading at a valuation that is consistent with its past performance.
This stock alert was generated using automated technology and GuruFocus financial data to provide readers with timely and accurate market reporting. This content was reviewed by GuruFocus editorial team prior to publication. Please send any questions or comments about this story to [email protected].

