
Tutor Perini (TPC) Secures $114M Contract for University of Mississippi Project


On June 09, 2026, Tutor Perini Corp TPC announced that its subsidiary, Roy Anderson, has secured a contract valued at approximately $114 million for the construction of the Jones Hall Project at the University of Mississippi in Oxford, MS. This project involves the development of a new four-story academic facility designed to enhance the educational infrastructure for the Patterson School of Accountancy.
- Current P/E ratio stands at 48.09x, indicating a high valuation relative to earnings.
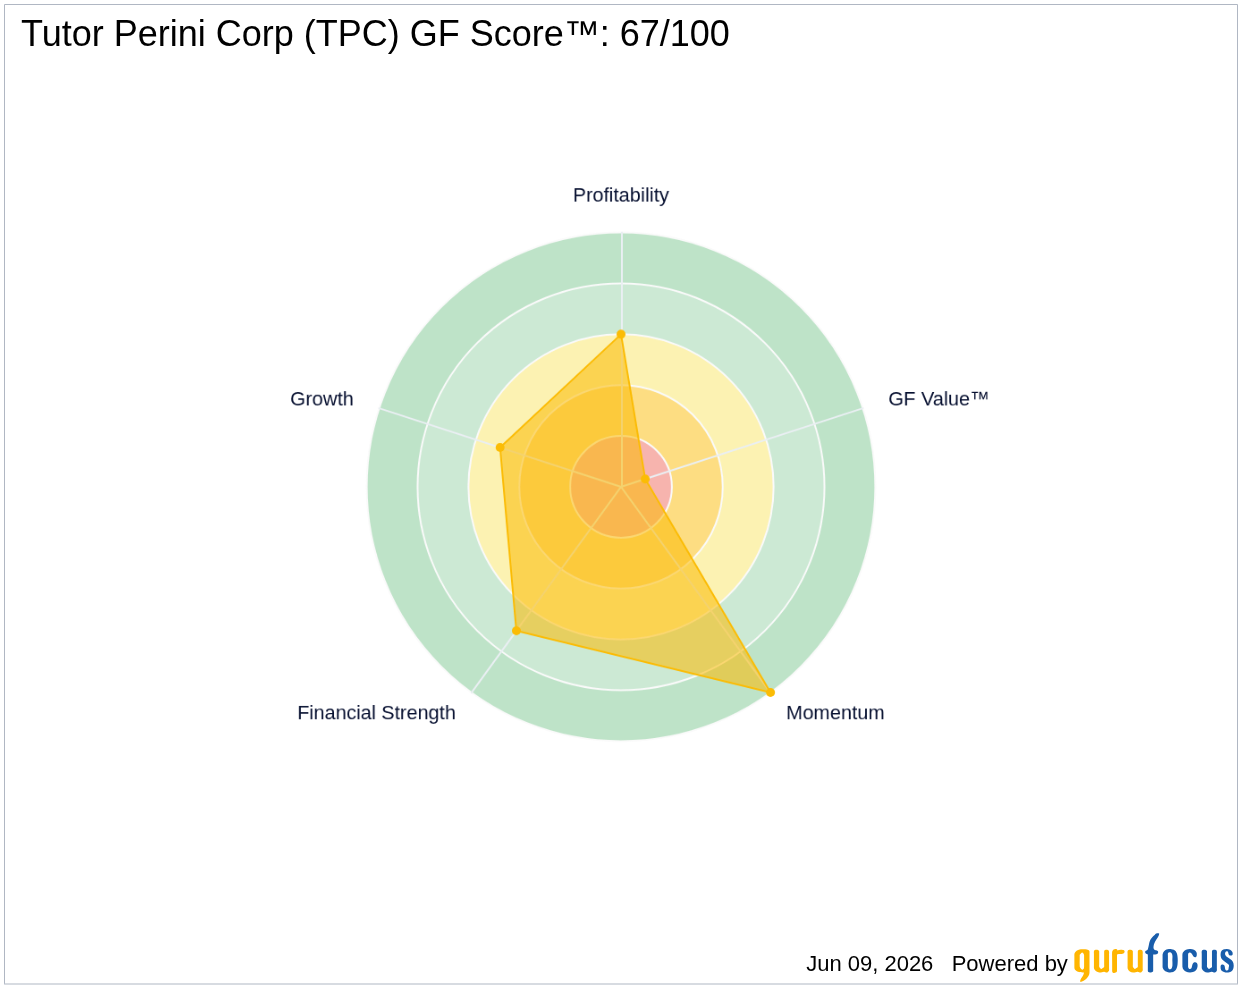
- GF Score™ of 67/100 suggests a solid overall performance, particularly in financial strength and profitability.
- Insider activity reveals $2.1 million in shares sold over the past three months, indicating potential caution among insiders.
What's Behind the News?
The recent contract awarded to Tutor Perini's subsidiary, Roy Anderson, marks a significant milestone for the company as it expands its footprint in the education sector. The Jones Hall Project will not only provide state-of-the-art facilities for the University of Mississippi but is also expected to enhance the learning experience for students. The project is strategically located next to the university's Grove, a popular gathering area, which may further increase the facility's visibility and accessibility.
Tutor Perini Corp operates within the industrials sector, specifically in the construction industry. With a market capitalization of approximately $3.72 billion, the company specializes in general contracting, construction management, and design-build services for both private and public clients. Its diverse portfolio includes transportation infrastructure, water-treatment facilities, and various building projects, with a significant portion of revenue generated from civil contracting services.
How Is TPC Valued?
Currently, GF Value™ data is not available for Tutor Perini Corp. However, the company's P/E ratio of 48.09x indicates that the stock is trading at a premium compared to its earnings. This high P/E ratio suggests that investors may have high expectations for future growth, but it also raises questions about the sustainability of such valuations. For more detailed information, visit the TPC stock page.
What Does TPC's GF Score™ Tell Us?
The GF Score™ ranks stocks from 0 to 100 based on five key aspects: Financial Strength, Profitability, Growth, Valuation, and Momentum. Stocks with higher GF Score™ values have been found to generate higher long-term returns (backtested 2006-2021).
| Metric | Rating |
|---|---|
| GF Score™ | 67 |
| Financial Strength | 7/10 |
| Profitability | 6/10 |
| Growth | 5/10 |
Tutor Perini Corp's GF Score™ of 67 indicates a relatively strong position, particularly in financial strength, where it scored 7 out of 10. However, the company faces challenges in profitability and growth, as indicated by its lower scores in these categories. This mixed performance suggests that while the company has a solid financial foundation, there are areas that require improvement to enhance overall investor confidence. For further insights, visit the TPC stock page.
What Are Insiders Doing with TPC Stock?
In the past three months, Tutor Perini Corp has seen insider selling amounting to $2.1 million, with no insider purchases reported during this period. This trend may signal a cautious outlook among insiders regarding the company's future performance.
What This Means for Investors
Overall, Tutor Perini Corp presents a mixed investment profile. While the recent contract win enhances its growth prospects, the high P/E ratio and insider selling activity may raise concerns for potential investors. The company's GF Score™ of 67 indicates a solid financial foundation, but challenges in profitability and growth remain.
For the complete analysis, visit the TPC stock page. You can also use the GuruFocus Stock Screener to find similar opportunities.
Frequently Asked Questions
What is TPC's GF Score™?
TPC's GF Score™ is 67/100, indicating a solid overall performance, particularly in financial strength and profitability.
How is TPC valued?
TPC's current P/E ratio is 48.09x, suggesting that the stock is trading at a premium relative to its earnings.
What is TPC's P/E ratio compared to historical?
The current P/E ratio of 48.09x is significantly higher than historical averages, indicating high investor expectations for future growth.
This stock alert was generated using automated technology and GuruFocus financial data to provide readers with timely and accurate market reporting. This content was reviewed by GuruFocus editorial team prior to publication. Please send any questions or comments about this story to [email protected].
We'd love to learn more about your experiences on GuruFocus.com and how we can improve!
Take Survey
