


On June 10, 2026, Taiwan Semiconductor Manufacturing Company TSM announced impressive revenue figures for May 2026, showcasing a robust performance in the semiconductor industry.
- Key valuation metric: TSM's P/E ratio stands at 35.55x, indicating a premium valuation compared to historical averages.
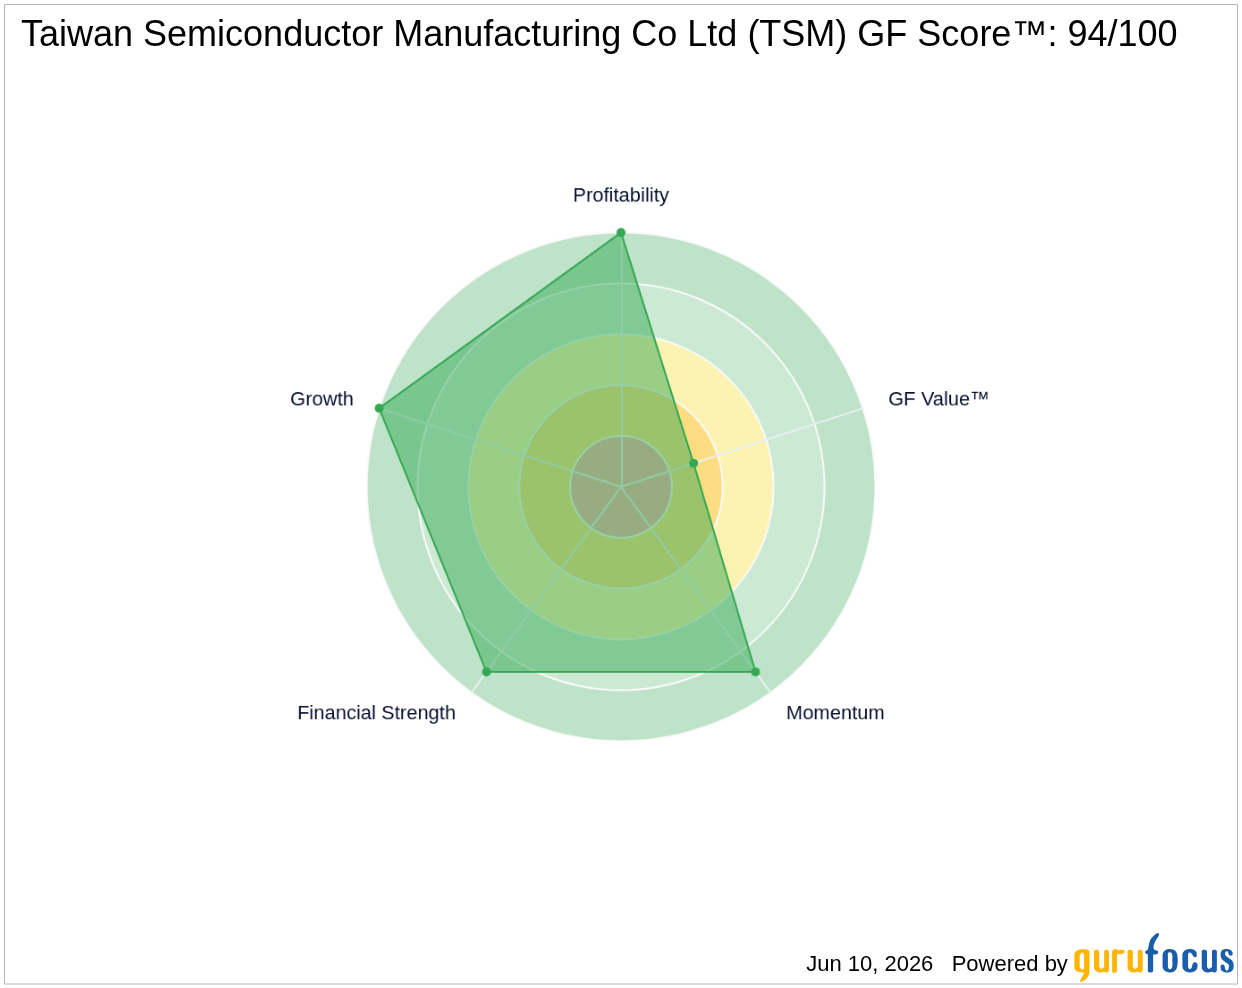
- GF Score™: 94/100, reflecting strong financial health and growth potential.
- Financial strength signal: TSM has a Piotroski F-Score of 8, indicating a very healthy financial situation.
What's Behind the News?
The announcement of NT$416.98 billion in revenue for May 2026 marks a 1.5% increase from April and a significant 30.1% rise year-over-year. This growth is largely attributed to the rising demand for AI-related chips, which have become critical components in various technological applications. The first five months of 2026 have seen TSMC's revenue reach NT$1.96 trillion, reflecting a 30.0% growth compared to the same period last year. However, despite these strong financial results, TSMC's shares experienced a decline of approximately 2.2% during trading in Taiwan, indicating market volatility or profit-taking by investors.
Founded in 1987, TSMC is the world's largest dedicated chip foundry, commanding about 70% market share in 2025. The company operates in the technology sector, specifically within the semiconductor industry, and has a market capitalization of approximately NT$2.22 trillion (around USD 71.5 billion). TSMC's scale and advanced technology enable it to maintain solid operating margins, even amid fierce competition. The company's client roster includes major players like Apple, AMD, and Nvidia, who rely on TSMC's cutting-edge process technologies for their semiconductor designs.
How Is TSM Valued?
While GF Value™ data is not available for TSM, the current P/E ratio of 35.55x suggests that the stock is trading at a premium compared to its historical averages. This valuation indicates that investors have high expectations for TSMC's future growth, particularly in light of its recent revenue performance and the ongoing demand for semiconductor technology. For more detailed information, visit the TSM stock page.
What Does TSM's GF Score™ Tell Us?
The GF Score™ ranks stocks from 0 to 100 based on five key aspects: Financial Strength, Profitability, Growth, Valuation, and Momentum. Stocks with higher GF Score™ values have been found to generate higher long-term returns (backtested 2006-2021).
| Metric | Rating |
|---|---|
| GF Score™ | 94 |
| Financial Strength | 9/10 |
| Profitability | 10/10 |
| Growth | 10/10 |
TSMC's strengths lie in its exceptional profitability and growth rankings, both rated at 10/10, indicating robust operational performance and future potential. The financial strength rating of 9/10 further underscores the company's solid balance sheet and operational stability. However, the valuation aspect remains a concern, as indicated by its high P/E ratio. For further insights, visit the TSM stock page.
What Are Insiders Doing with TSM Stock?
In the past three months, insider activity indicates a net sell of $14 million, with no reported insider purchases during the same period. This could suggest a cautious outlook among insiders, despite the company's strong financial performance.
What This Means for Investors
Overall, TSMC's strong revenue growth and high GF Score™ reflect its solid position in the semiconductor market. However, the elevated P/E ratio and recent insider selling may warrant caution for potential investors. For the complete analysis, visit the TSM stock page. You can also use the GuruFocus Stock Screener to find similar opportunities.
Frequently Asked Questions
What is TSM's GF Score™?
TSM's GF Score™ is 94/100, indicating a strong financial health and growth potential.
How is TSM valued?
TSM's current P/E ratio is 35.55x, suggesting that the stock is trading at a premium compared to its historical averages.
What is TSM's P/E ratio compared to historical?
TSM's P/E ratio of 35.55x is close to its 10-year high, indicating that the stock is valued highly by investors based on future growth expectations.
This stock alert was generated using automated technology and GuruFocus financial data to provide readers with timely and accurate market reporting. This content was reviewed by GuruFocus editorial team prior to publication. Please send any questions or comments about this story to [email protected].

