


On June 12, 2026, the recent reshuffle of the Nasdaq-100 has brought in five companies showcasing impressive year-to-date growth, with Nebius Group NBIS topping the list at a remarkable 165.5%. Other notable additions include Astera Labs (ALAB) at 120.9%, Teradyne (TER) at 97.0%, Rocket Lab (RKLB) at 64.5%, and CoreWeave (CRWV) at 33.7%. Conversely, several companies are exiting the index, including Insmed (INSM), which has dropped 44.4% year-to-date.
- Key valuation metric: Nebius Group's P/E ratio stands at 73.01x.
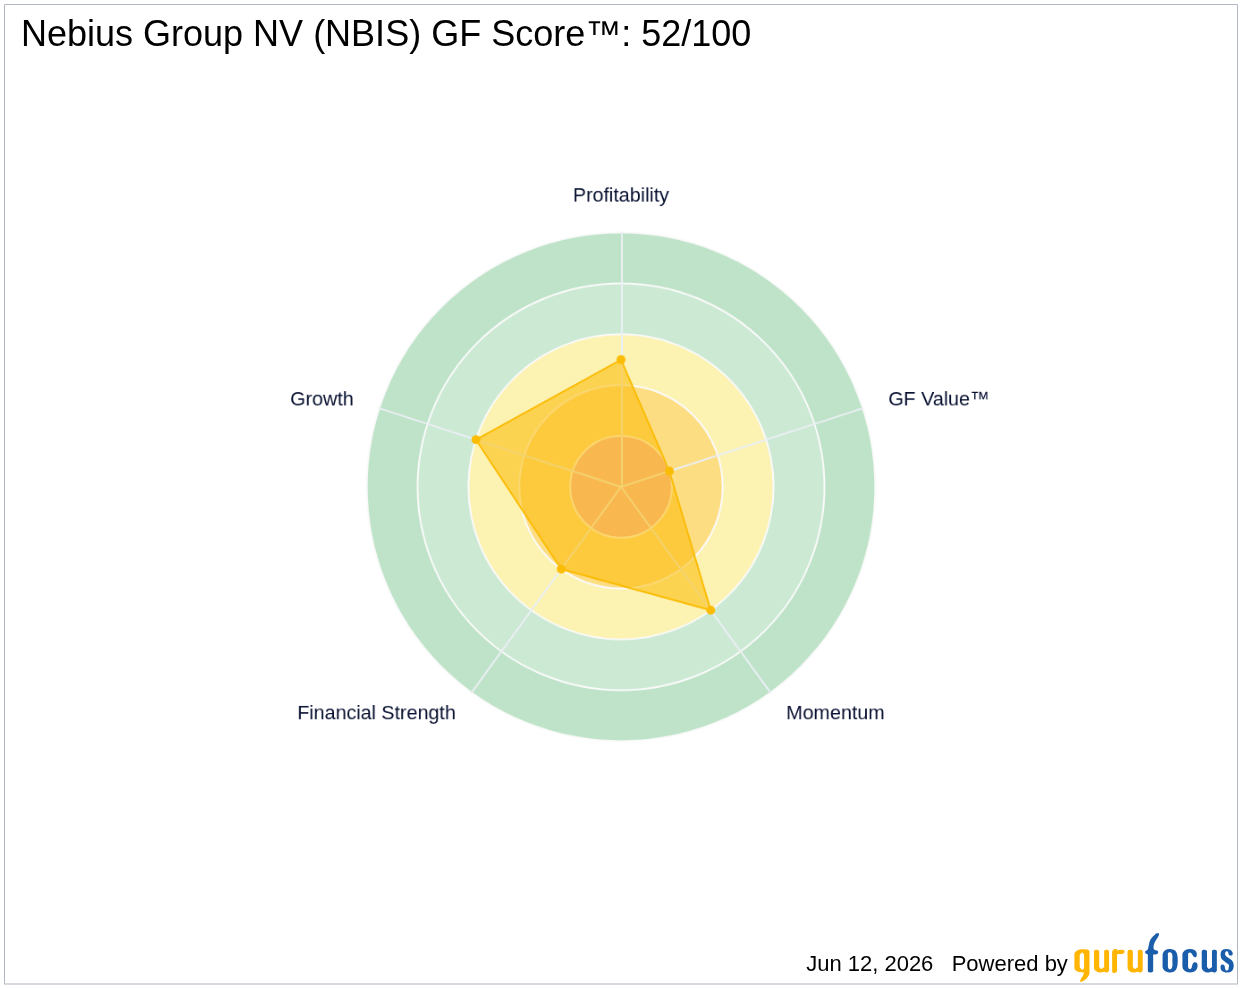
- GF Score™: 52/100, indicating a moderate overall performance.
- Insider activity shows significant selling, with $131 million in shares sold over the past three months.
What's Behind the News?
The reshuffle of the Nasdaq-100 is a significant event in the financial markets, as it reflects the changing dynamics and performance of leading companies. Nebius Group's inclusion is particularly noteworthy given its staggering year-to-date growth of 165.5%, which positions it as a standout performer among its peers. This growth is indicative of the company's strong market presence and potential for future expansion, especially in the rapidly evolving technology sector.
Nebius Group NV operates as a vertically integrated cloud provider focusing on artificial intelligence (AI) and high-performance computing. The company, a carve-out of the previous Russian tech firm Yandex, has established itself in the market following the sanctions imposed due to the Ukraine-Russia war. With a market capitalization of approximately $56.43 billion, Nebius designs and operates its own data centers and servers across Europe and the US, boasting a total capacity of several hundred megawatts. The recent multiyear $17 billion revenue agreement with Microsoft further solidifies its position in the industry.
How Is NBIS Valued?
Currently, GF Value™ data is not available for Nebius Group. However, the company's P/E ratio of 73.01x indicates that investors are willing to pay a premium for its earnings potential, which is significantly higher than the average market P/E. This high valuation may reflect investor optimism about Nebius's growth prospects, particularly in the AI and cloud computing sectors. For more detailed information, visit the NBIS stock page.
What Does NBIS's GF Score™ Tell Us?
The GF Score™ ranks stocks from 0 to 100 based on five key aspects: Financial Strength, Profitability, Growth, Valuation, and Momentum. Stocks with higher GF Score™ values have been found to generate higher long-term returns (backtested 2006-2021).
| Metric | Rating |
|---|---|
| GF Score™ | 52 |
| Financial Strength | 4/10 |
| Profitability | 5/10 |
| Growth | 6/10 |
Nebius Group's GF Score™ of 52 indicates a moderate performance, with strengths in growth (6/10) and profitability (5/10), but it faces challenges in financial strength (4/10). The company has shown impressive revenue growth, but its high P/E ratio and the potential for earnings manipulation raise concerns about its long-term sustainability. For further insights, visit the NBIS stock page.
What Are Insiders Doing with NBIS Stock?
Insider activity for Nebius Group has been notably negative, with $131 million in shares sold over the past three months and no reported insider buying. This trend may signal a lack of confidence among insiders regarding the company's future performance.
What This Means for Investors
Given the mixed signals from Nebius Group's financial metrics and insider activity, investors should approach this stock with caution. While the company's growth trajectory is impressive, the high valuation and potential financial red flags warrant a thorough analysis before making investment decisions. For the complete analysis, visit the NBIS stock page. You can also use the GuruFocus Stock Screener to find similar opportunities.
Frequently Asked Questions
What is NBIS's GF Score™?
Nebius Group has a GF Score™ of 52, indicating a moderate overall performance based on key financial metrics.
How is NBIS valued?
The company has a P/E ratio of 73.01x, suggesting that investors are paying a premium for its earnings potential, reflecting strong growth expectations.
What is NBIS's P/E ratio compared to historical?
While historical P/E data is not provided, Nebius's current P/E ratio of 73.01x is significantly higher than typical market valuations, indicating strong investor optimism.
This stock alert was generated using automated technology and GuruFocus financial data to provide readers with timely and accurate market reporting. This content was reviewed by GuruFocus editorial team prior to publication. Please send any questions or comments about this story to [email protected].

