


On June 15, 2026, Trading Technologies International announced a strategic alliance with ICE Data Services, a division of Intercontinental Exchange (NYSE: ICE), to integrate foundational evaluated prices and reference data into its upcoming buy-side Fixed Income execution management system. This collaboration aims to enhance Trading Technologies' offerings by providing ICE's "Continuously Evaluated Price" market data feed to its clients.
- ICE's current P/E ratio stands at 20.46, indicating its valuation relative to earnings.
- GF Score™: 87/100, suggesting a strong overall performance in key financial metrics.
- Insider activity shows significant selling, with $1.9 million in shares sold over the past three months.
What's Behind the News?
The partnership between Trading Technologies and ICE Data Services is significant as it marks a strategic move to enhance Trading Technologies' capabilities in the fixed income market. By integrating ICE's evaluated prices and reference data, the new buy-side fixed income execution management system is expected to provide a more comprehensive trading experience for clients, particularly in USD Rates and Credit products. This integration will allow clients to leverage the familiar trading tools and post-trade services they already use for futures, options, and foreign exchange trades, thereby streamlining their operations.
Intercontinental Exchange Inc is a leading operator of financial exchanges and a provider of data services for commodity and financial markets. With a market capitalization of approximately $79.47 billion, ICE operates a diverse range of exchanges, including the New York Stock Exchange, which it acquired in 2013. The company generates revenue from various segments, including exchanges, mortgage technology, and fixed-income and data services, making it a key player in the financial services sector.
How Is ICE Valued?
While GF Value™ data is not available for Intercontinental Exchange, its current P/E ratio of 20.46 suggests that the stock is trading at a valuation that reflects its earnings potential. This P/E ratio is close to its historical low, indicating that the stock may be undervalued relative to its earnings. Investors may find this metric useful when considering the stock's potential for future growth. For more detailed information, visit the ICE stock page.
What Does ICE's GF Score™ Tell Us?
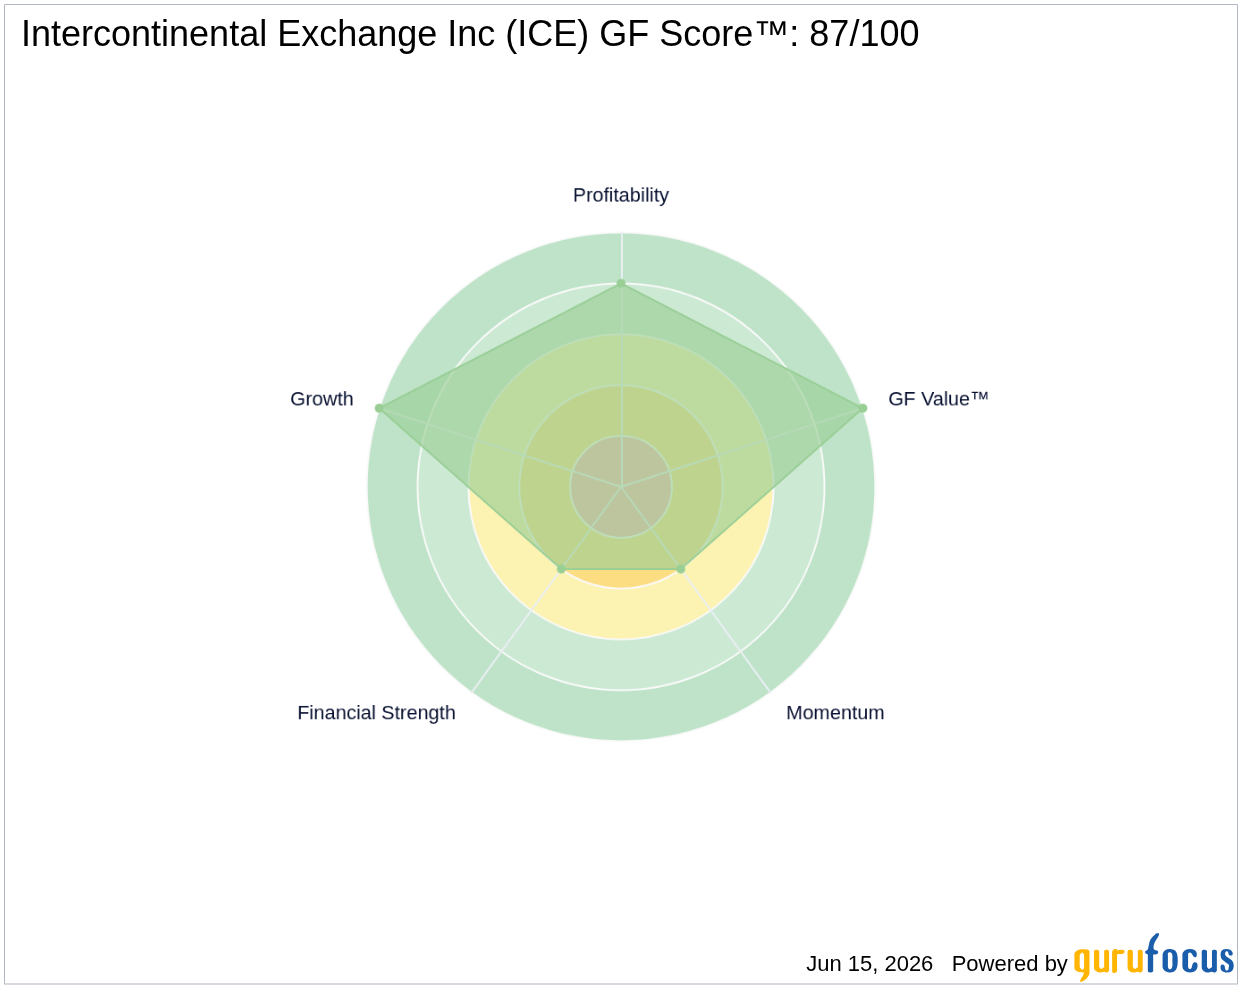
The GF Score™ ranks stocks from 0 to 100 based on five key aspects: Financial Strength, Profitability, Growth, Valuation, and Momentum. Stocks with higher GF Score™ values have been found to generate higher long-term returns (backtested 2006-2021).
| Metric | Rating |
|---|---|
| GF Score™ | 87 |
| Financial Strength | 4/10 |
| Profitability | 8/10 |
| Growth | 10/10 |
Intercontinental Exchange's strengths lie in its high GF Score™ of 87, indicating robust performance in profitability and growth metrics. However, its financial strength rating of 4/10 suggests some concerns regarding its balance sheet. This mixed picture highlights the importance of considering multiple factors when evaluating the company's overall health. For further insights, visit the ICE stock page.
What Are Insiders Doing with ICE Stock?
Recent insider activity has shown a notable trend, with insiders selling $1.9 million worth of shares over the past three months and no purchases recorded during the same period. This selling activity may raise questions about insider sentiment towards the company's future prospects.
What This Means for Investors
Overall, Intercontinental Exchange presents a compelling case with its strong GF Score™ and solid growth metrics. However, the recent insider selling and financial strength concerns warrant careful consideration. Investors should weigh these factors against their investment strategies and risk tolerance. For the complete analysis, visit the ICE stock page. You can also use the GuruFocus Stock Screener to find similar opportunities.
Frequently Asked Questions
What is ICE's GF Score™?
ICE's GF Score™ is 87/100, indicating a strong overall performance in key financial metrics, particularly in profitability and growth.
How is ICE valued?
ICE's current P/E ratio is 20.46, which suggests that the stock is trading at a valuation that reflects its earnings potential, close to its historical low.
What is ICE's P/E ratio compared to historical?
ICE's P/E ratio of 20.46 is close to its historical low, indicating that the stock may be undervalued relative to its earnings potential.
This stock alert was generated using automated technology and GuruFocus financial data to provide readers with timely and accurate market reporting. This content was reviewed by GuruFocus editorial team prior to publication. Please send any questions or comments about this story to [email protected].

