


On June 16, 2026, Qualcomm Inc QCOM is in negotiations to acquire Tenstorrent, an AI chip startup, with discussions indicating a price range of $8 billion to $10 billion. This potential deal would significantly exceed Tenstorrent's last valuation. The ongoing talks might involve performance-related payments, similar to previous chip startup acquisitions. If completed, this acquisition would enhance Qualcomm's capabilities in AI and data center technologies.
- Qualcomm's market cap stands at approximately $237.6 billion.
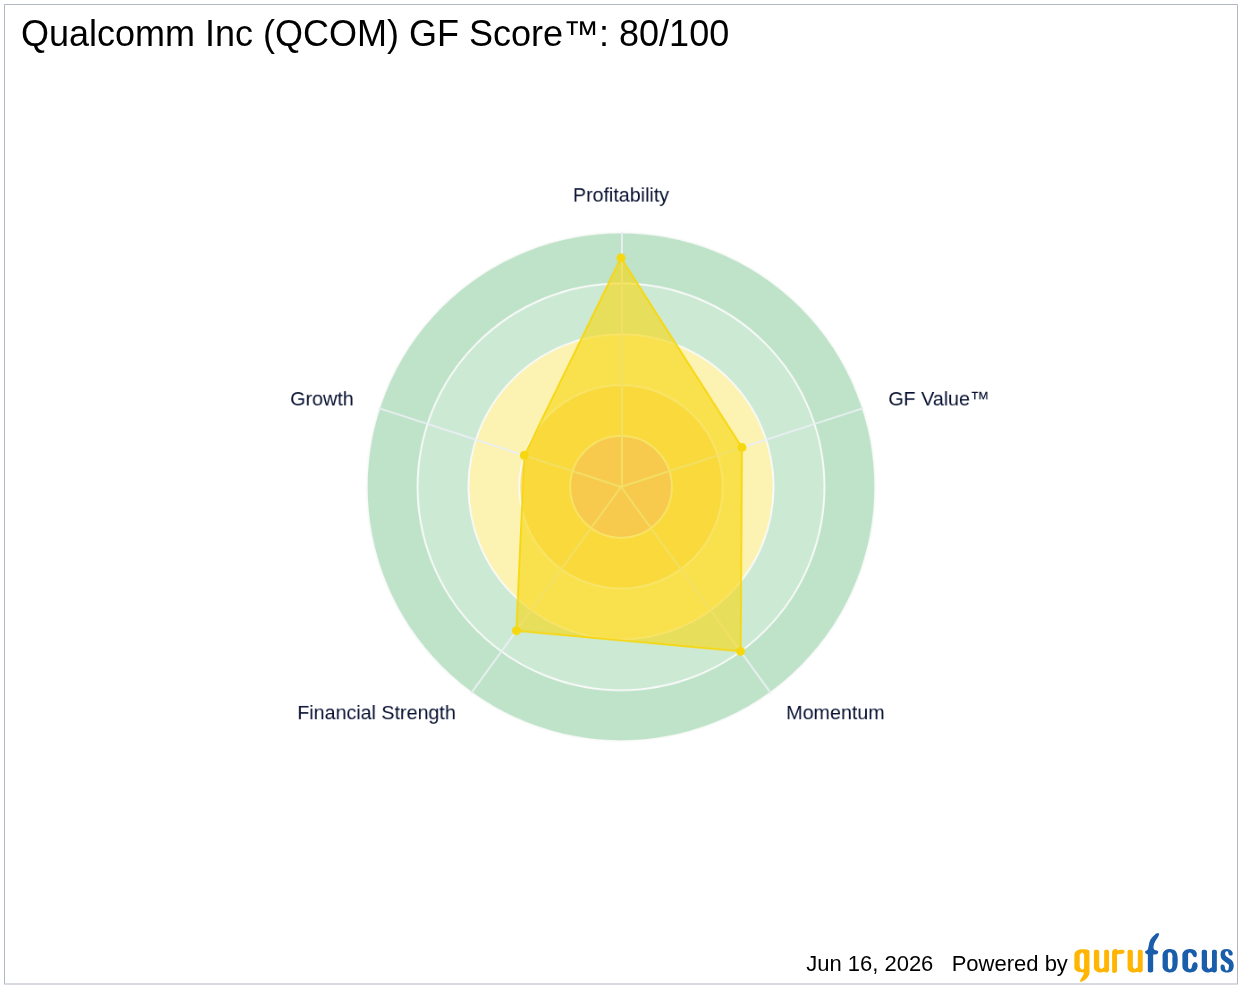
- GF Score™: 80/100, indicating a strong overall performance relative to peers.
- Insider activity shows $5.8 million in shares sold over the past three months.
What's Behind the News?
The acquisition of Tenstorrent by Qualcomm represents a strategic move to bolster its position in the rapidly growing AI and data center markets. Founded in 2016 by Jim Keller, Tenstorrent has focused on developing efficient chip designs tailored for AI workloads, competing against established players such as Nvidia. This acquisition could provide Qualcomm with advanced technology and talent, enhancing its product offerings and market competitiveness.
Qualcomm is a leading player in the technology sector, specifically within the semiconductor industry. The company develops and licenses wireless technology and designs chips primarily for smartphones. With a market cap of approximately $237.6 billion, Qualcomm is recognized as the world's largest wireless chip vendor, supplying cutting-edge processors to major handset manufacturers. The company's robust portfolio includes key patents in CDMA and OFDMA technologies, which are foundational to 3G, 4G, and 5G networks.
How Is QCOM Valued?
Currently, GF Value™ data is not available for Qualcomm. However, the company's P/E ratio stands at 24.51, which is a critical metric for assessing its valuation relative to earnings. This P/E ratio indicates that investors are willing to pay $24.51 for every dollar of earnings, reflecting market expectations about future growth. For further details on Qualcomm's valuation metrics, visit the QCOM stock page.
What Does QCOM's GF Score™ Tell Us?
The GF Score™ ranks stocks from 0 to 100 based on five key aspects: Financial Strength, Profitability, Growth, Valuation, and Momentum. Stocks with higher GF Score™ values have been found to generate higher long-term returns (backtested 2006-2021).
| GF Score™ | 80 |
| Financial Strength | 7/10 |
| Profitability | 9/10 |
| Growth | 4/10 |
Qualcomm's strengths lie in its strong profitability and financial strength, as indicated by its high GF Score™ of 80. The company ranks 9 out of 10 in profitability, reflecting its ability to generate substantial earnings relative to its revenue. However, its growth rank of 4 suggests that while it is performing well, there may be challenges in sustaining high growth rates moving forward. For more insights, visit the QCOM stock page.
What Are Insiders Doing with QCOM Stock?
In the past three months, Qualcomm has experienced significant insider selling, with a total of $5.8 million in shares sold and no insider buying reported. This trend may indicate a lack of confidence among insiders regarding the company's immediate prospects, but it is essential to consider the broader context of insider activity.
What This Means for Investors
Qualcomm's ongoing negotiations to acquire Tenstorrent could position the company favorably within the AI chip market, potentially driving future growth. However, the recent insider selling raises questions about insider sentiment and market expectations. Investors should weigh these factors carefully as they consider their positions in Qualcomm.
For the complete analysis, visit the QCOM stock page. You can also use the GuruFocus Stock Screener to find similar opportunities.
Frequently Asked Questions
What is QCOM's GF Score™?
QCOM's GF Score™ is 80/100, indicating a strong overall performance relative to its peers, suggesting potential for long-term returns.
How is QCOM valued?
QCOM has a P/E ratio of 24.51, which reflects the market's expectations for the company's future earnings growth.
What is QCOM's P/E ratio compared to historical?
While specific historical P/E data is not provided, QCOM's current P/E ratio of 24.51 indicates that investors are valuing the stock at a premium compared to its earnings, reflecting confidence in its future growth potential.
This stock alert was generated using automated technology and GuruFocus financial data to provide readers with timely and accurate market reporting. This content was reviewed by GuruFocus editorial team prior to publication. Please send any questions or comments about this story to [email protected].

