


On June 16, 2026, Goldman Sachs (GS) has solidified its position at the top of the M&A advisory rankings, guiding $1.1 trillion in transactions by mid-2026. This figure marks a substantial 71% increase from $649.9 billion during the same period last year. Overall global M&A activity rose 35% year-over-year to $2.66 trillion, with Goldman advising on approximately 42% of the total deal value. JPMorgan Chase (JPM) and Morgan Stanley (MS) followed in second and third places, advising on $687.1 billion and $574.4 billion, respectively.
- Goldman Sachs has a market cap of approximately $2.64 trillion.
- GF Score™: 94/100, indicating strong overall performance.
- Insider activity shows $51.6 million in shares sold over the past three months.
What's Behind the News?
The impressive performance of Goldman Sachs in the M&A advisory space reflects its strong market position and expertise in navigating complex transactions. The firm's ability to advise on $1.1 trillion in deals not only highlights its dominance but also signifies a robust recovery in global M&A activity, which has surged to $2.66 trillion. This growth is indicative of increased corporate confidence and strategic realignments in various sectors.
Goldman Sachs operates primarily in the financial services sector, providing a wide range of investment banking, securities, and investment management services. With a market capitalization of approximately $2.64 trillion, it stands as a leader in the industry, leveraging its extensive network and expertise to drive significant transaction volumes. The firm's strategic positioning in the market allows it to capitalize on emerging trends and opportunities, further solidifying its status as a go-to advisor for major corporations.
How Is AMZN Valued?
While GF Value™ data is not available for Amazon.com Inc AMZN, the company's P/E ratio stands at 29.4x, which provides a context for its valuation relative to its earnings. Given the company's strong growth trajectory and market presence, this P/E ratio suggests that investors are willing to pay a premium for its future earnings potential. For more detailed insights, visit the AMZN stock page.
What Does AMZN's GF Score™ Tell Us?
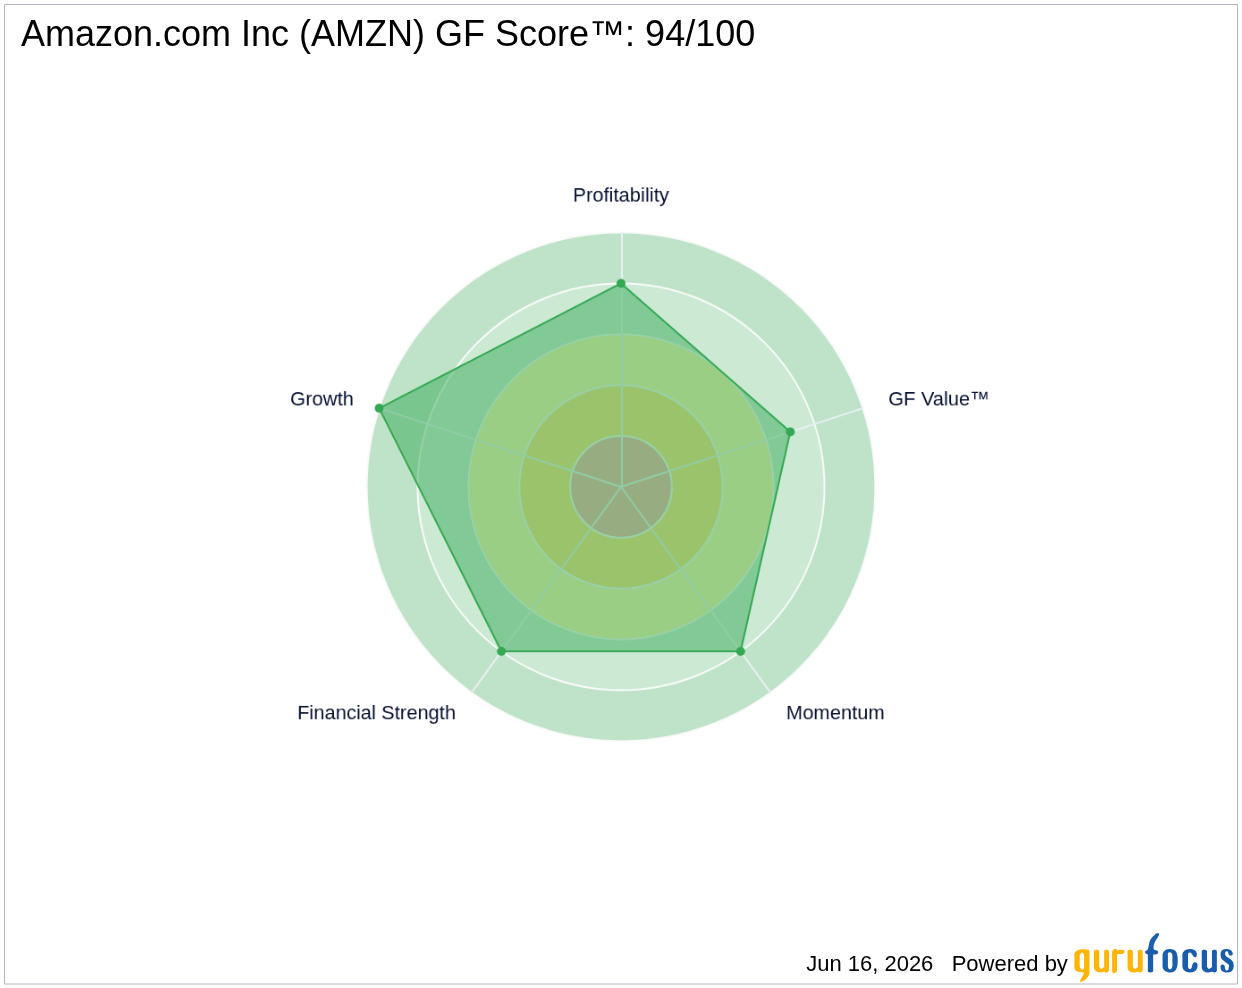
The GF Score™ ranks stocks from 0 to 100 based on five key aspects: Financial Strength, Profitability, Growth, Valuation, and Momentum. Stocks with higher GF Score™ values have been found to generate higher long-term returns (backtested 2006-2021).
| Metric | Rating |
|---|---|
| GF Score™ | 94 |
| Financial Strength | 8/10 |
| Profitability | 8/10 |
| Growth | 10/10 |
AMZN's strengths are highlighted by its impressive GF Score™ of 94, indicating strong financial health and growth potential. The company ranks highly in both financial strength and growth, suggesting a solid foundation for future performance. However, the valuation aspect may warrant further scrutiny, especially considering the current market dynamics. For more insights, visit the AMZN stock page.
What Are Insiders Doing with AMZN Stock?
In the past three months, insider activity for Amazon.com Inc shows a significant amount of selling, totaling $51.6 million, with no reported insider buying. This trend may raise questions about insider confidence in the company's short-term prospects.
What This Means for Investors
Given the strong GF Score™ and the company's solid financial metrics, Amazon.com Inc appears to be well-positioned for continued growth. However, the recent insider selling may warrant caution for potential investors. For the complete analysis, visit the AMZN stock page. You can also use the GuruFocus Stock Screener to find similar opportunities.
Frequently Asked Questions
What is AMZN's GF Score™?
AMZN's GF Score™ is 94/100, indicating strong overall performance across various financial metrics.
How is AMZN valued?
AMZN's P/E ratio is currently at 29.4x, suggesting that the market values the stock at a premium relative to its earnings.
What is AMZN's P/E ratio compared to historical?
AMZN's current P/E ratio of 29.4x is indicative of investor confidence, although it may be higher than historical averages, reflecting growth expectations.
This stock alert was generated using automated technology and GuruFocus financial data to provide readers with timely and accurate market reporting. This content was reviewed by GuruFocus editorial team prior to publication. Please send any questions or comments about this story to [email protected].

