


On June 21, 2026, Taiwan Semiconductor Manufacturing Company TSM has made headlines by significantly reducing its monthly wafer production at its Fab 15A facility for 28nm technology. The output has dropped from 200,000 wafers at the beginning of the year to 150,000 wafers, reflecting a decrease of over 25%. This strategic shift indicates TSM's intent to optimize its production efficiency in response to market dynamics.
- GF Value™ verdict: Current Price $462.12 vs GF Value™ $312.45, indicating TSM is 47.9% overvalued.
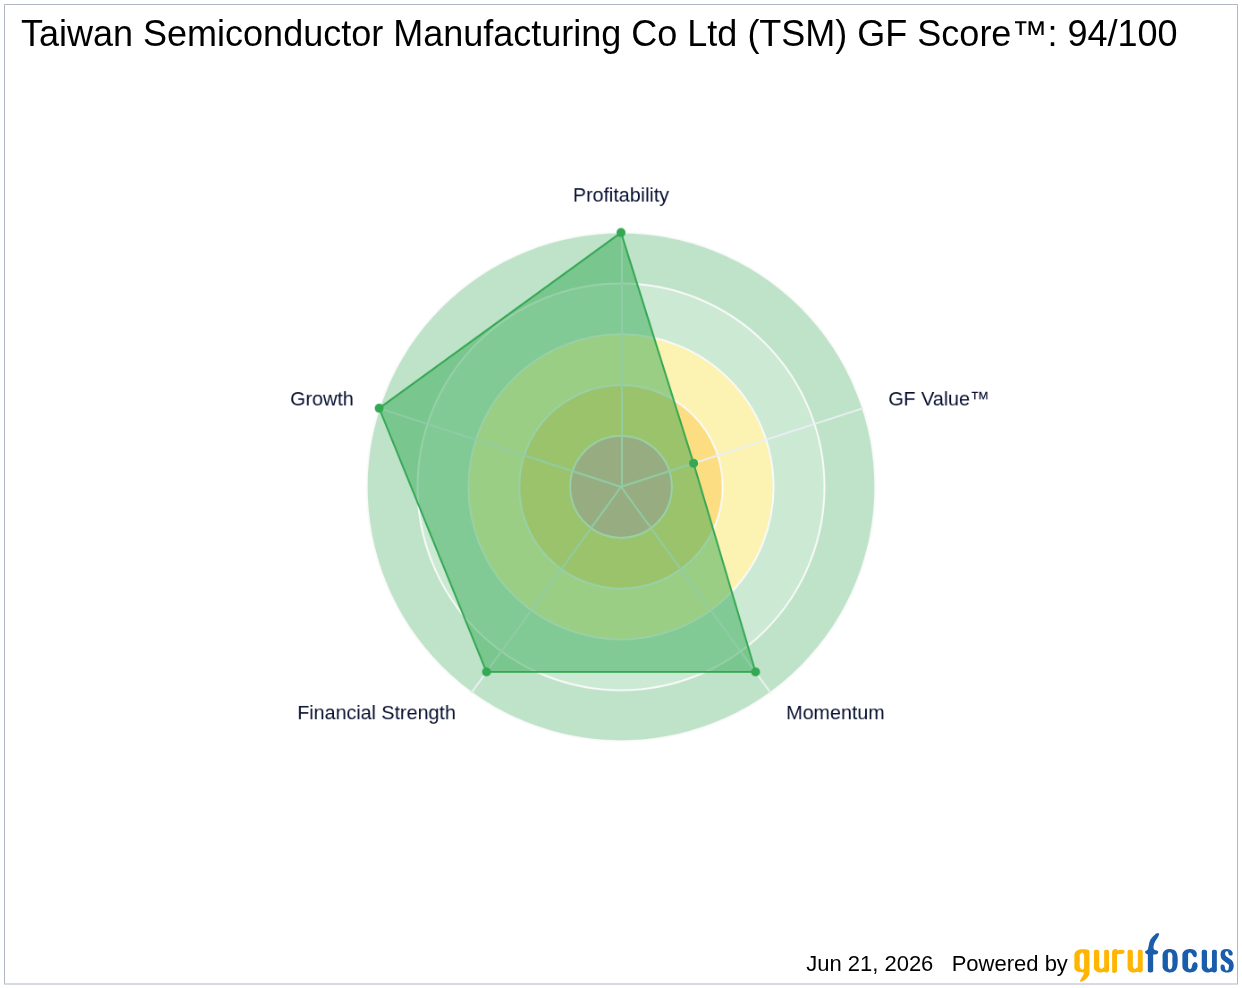
- GF Score™: 94/100, suggesting strong overall performance.
- Key financial signal: TSM's P/E (TTM) is 32.4x, significantly higher than its 5-year median P/E of 22.78x.
What's Behind the News?
The recent production cut at TSMC's Fab 15A facility is a strategic decision aimed at enhancing the company's capacity for 28nm production. This move comes as TSMC seeks to phase out low-margin orders while focusing on meeting the growing demands for intermediate-layer technologies. The reduction in wafer output from 200,000 to 150,000 per month not only reflects a shift in production strategy but also highlights the company's responsiveness to changing market conditions and customer needs.
Founded in 1987, Taiwan Semiconductor Manufacturing Co. Ltd. is the world's largest dedicated chip foundry, boasting a market share of about 70% as of 2025. With a market capitalization of approximately $2.4 trillion, TSMC operates within the technology sector, specifically in the semiconductors industry. The company's scale and advanced technology enable it to maintain solid operating margins, even amid fierce competition. TSMC's illustrious customer base includes industry giants like Apple, AMD, and Nvidia, who rely on TSMC's cutting-edge process technologies for their semiconductor designs.
Is TSM Overvalued or Undervalued?
According to GuruFocus, TSMC's GF Value™ is calculated at $312.45, which indicates that the stock is currently trading at a significant premium, being 47.9% overvalued at its current price of $462.12. This valuation suggests a lack of margin of safety for potential investors, as the stock price exceeds its intrinsic value by a considerable margin. The high valuation could pose risks if the company's growth does not meet market expectations.
Additionally, TSM's P/E (TTM) stands at 32.4x, which is substantially higher than its 5-year median P/E of 22.78x. This discrepancy indicates that investors are currently paying a premium for TSMC's earnings compared to its historical performance. For more detailed insights, visit GF Value™.
What Does TSM's GF Score™ Tell Us?
The GF Score™ ranks stocks from 0 to 100 based on five key aspects: Financial Strength, Profitability, Growth, Valuation, and Momentum. Stocks with higher GF Score™ values have been found to generate higher long-term returns (backtested 2006-2021).
| Metric | Rating |
|---|---|
| GF Score™ | 94 |
| Financial Strength | 9/10 |
| Profitability | 10/10 |
| Growth | 10/10 |
| Valuation | 3/10 |
| Momentum | 9/10 |
TSMC's high GF Score™ of 94 indicates strong financial health, exceptional profitability, and robust growth prospects. However, the low valuation rank of 3 suggests that the stock may be overvalued, which could be a concern for potential investors. For more information, visit the TSM stock page.
What Are Insiders Doing with TSM Stock?
In the past three months, insider activity has shown a significant disparity, with insiders selling $14.0 million worth of shares compared to $1.3 million in purchases. This trend raises questions about the confidence of insiders in the company's future performance.
What This Means for Investors
Given the current valuation metrics and insider selling activity, TSMC appears to be significantly overvalued at its current price level. Investors should exercise caution and consider the implications of the company's production adjustments and market positioning. For the complete analysis, visit the TSM stock page. You can also use the GuruFocus Stock Screener to find similar opportunities.
Frequently Asked Questions
What is TSM's GF Score™?
TSM's GF Score™ is 94/100, indicating strong overall performance across various financial metrics.
Is TSM overvalued or undervalued?
TSM is currently overvalued, with a GF Value™ of $312.45 compared to its current price of $462.12, indicating a 47.9% overvaluation.
What is TSM's P/E ratio compared to historical?
TSM's P/E (TTM) is 32.4x, which is significantly higher than its 5-year median P/E of 22.78x, suggesting that the stock is trading at a premium compared to its historical valuation.
This stock alert was generated using automated technology and GuruFocus financial data to provide readers with timely and accurate market reporting. This content was reviewed by GuruFocus editorial team prior to publication. Please send any questions or comments about this story to [email protected].

