

On June 24, 2026, the latest pivot points for the Health Care Select Sector SPDR XLV indicate a pivot high at $153.02 and a pivot low at $151.59, derived using the DeMark methodology. A breakout above the pivot high is typically interpreted as a bullish signal, suggesting potential upward momentum, while a decline below the pivot low is seen as bearish, indicating possible downward pressure on the stock.
- Market Cap: $38.93 billion
- GF Score™: 84/100, indicating strong overall performance in key financial metrics
- Profitability Rank: 8/10, reflecting solid profit margins and operational efficiency
What's Behind the News?
The Health Care Select Sector SPDR ETF XLV is a key player in the healthcare investment landscape, providing investors with exposure to a diverse range of healthcare companies. The recent pivot points suggest that traders are closely monitoring the ETF's price movements, with the potential for significant volatility in the near term. A breakout above the pivot high could signal renewed investor confidence in the healthcare sector, while a drop below the pivot low may prompt caution among investors.
As of now, XLV has a market capitalization of approximately $38.93 billion, positioning it as a significant entity within the healthcare sector. The ETF includes a variety of healthcare-related stocks, making it a popular choice for investors looking to gain exposure to this essential industry. The current price of XLV is $152.18, which is situated between the identified pivot points, indicating a critical juncture for potential price movements.
How Is XLV Valued?
Currently, GF Value™ data is not available for XLV, which limits the ability to assess its intrinsic value comprehensively. However, the ETF's P/E ratio stands at 24.85x, which may suggest that it is trading at a premium compared to historical averages in the healthcare sector. This P/E ratio is a critical metric for investors as it provides insight into how the market values the earnings potential of the ETF's underlying assets. For more detailed information, visit the XLV stock page.
What Does XLV's GF Score™ Tell Us?
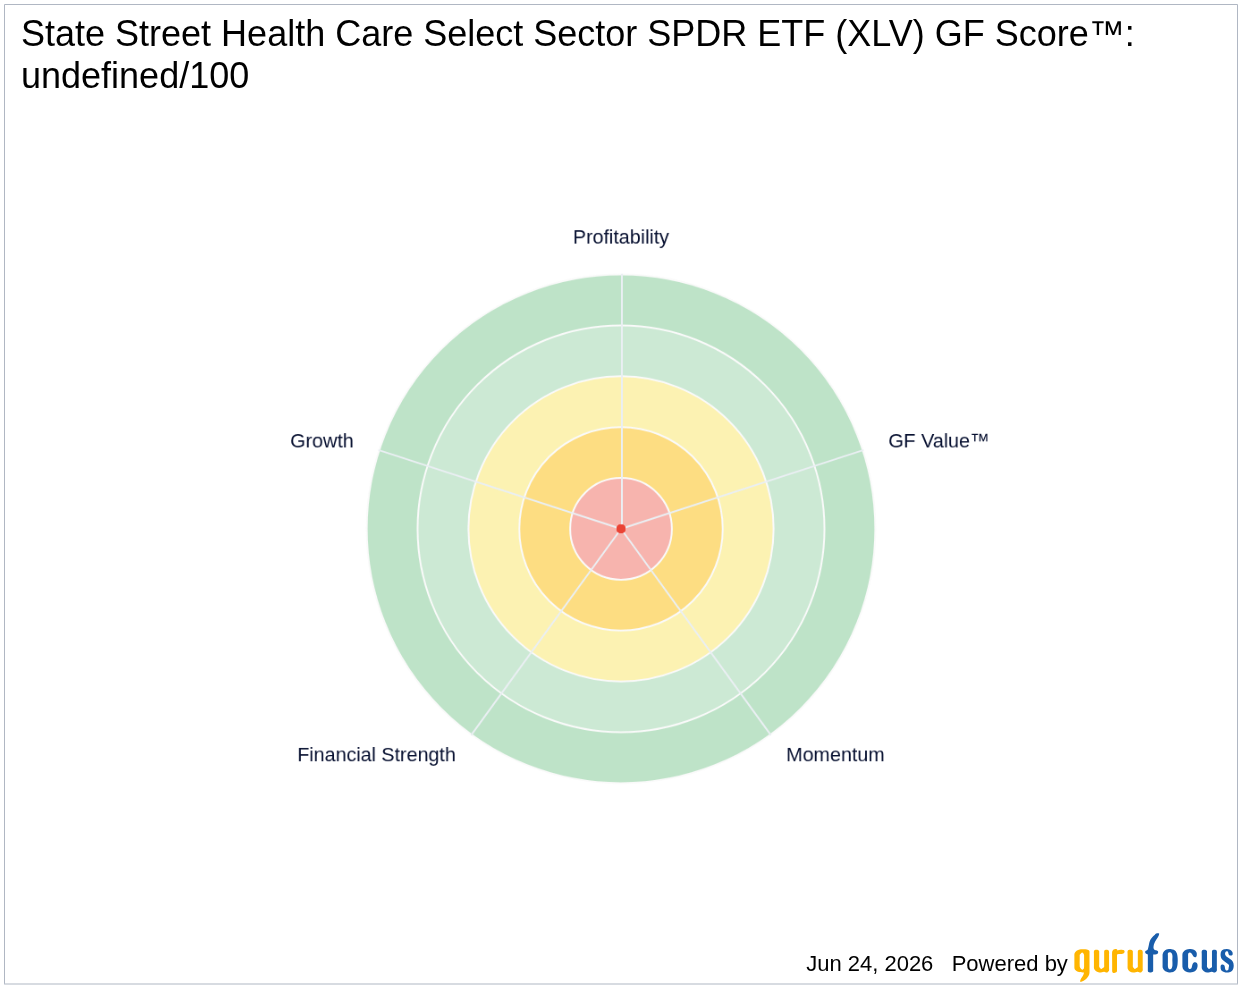
The GF Score™ ranks stocks from 0 to 100 based on five key aspects: Financial Strength, Profitability, Growth, Valuation, and Momentum. Stocks with higher GF Score™ values have been found to generate higher long-term returns (backtested 2006-2021).
| GF Score™ | 84 |
| Financial Strength | 6/10 |
| Profitability | 8/10 |
| Growth | 8/10 |
XLV's strengths lie in its strong profitability and growth rankings, both rated at 8/10, indicating robust operational efficiency and potential for future earnings growth. However, its financial strength rating of 6/10 suggests that while the ETF is stable, there may be areas for improvement. Overall, the high GF Score™ of 84 indicates that XLV is well-positioned for long-term performance. For further insights, visit the XLV stock page.
What Are Insiders Doing with XLV Stock?
There has been no insider buying or selling activity reported for XLV in the past 12 months, indicating a lack of insider movement that could suggest confidence or concern among company executives.
What This Means for Investors
The current data suggests that XLV is at a pivotal point, with its price hovering between key technical levels. Investors should monitor the ETF closely for any breakout or breakdown signals, as these could greatly influence short-term trading strategies. The strong GF Score™ and profitability metrics indicate a solid foundation, but caution is warranted given the current market conditions.
For the complete analysis, visit the XLV stock page. You can also use the GuruFocus Stock Screener to find similar opportunities.
Frequently Asked Questions
What is XLV's GF Score™?
XLV has a GF Score™ of 84/100, indicating strong performance across key financial metrics.
How is XLV valued?
XLV's P/E ratio is currently 24.85x, suggesting it may be trading at a premium compared to historical averages.
What is XLV's P/E ratio compared to historical?
The P/E ratio of 24.85x indicates that XLV is valued higher than its historical norms, reflecting investor confidence in its future earnings potential.
This stock alert was generated using automated technology and GuruFocus financial data to provide readers with timely and accurate market reporting. This content was reviewed by GuruFocus editorial team prior to publication. Please send any questions or comments about this story to [email protected].

