


On June 24, 2026, Japan's Prime Minister Sanae Takaichi unveiled a comprehensive economic development plan that aims to significantly invest in artificial intelligence (AI), semiconductors, defense, space, and shipbuilding. The initiative outlines over 370 trillion yen (approximately $2.3 trillion) in investments over the next 14 years, with 101.6 trillion yen earmarked specifically for AI and semiconductor sectors. This news is particularly relevant for investors in technology sectors, including Super Micro Computer Inc SMCI.
- GF Value™ verdict: $86.77 vs Current Price $33.51 = 61.4% undervalued
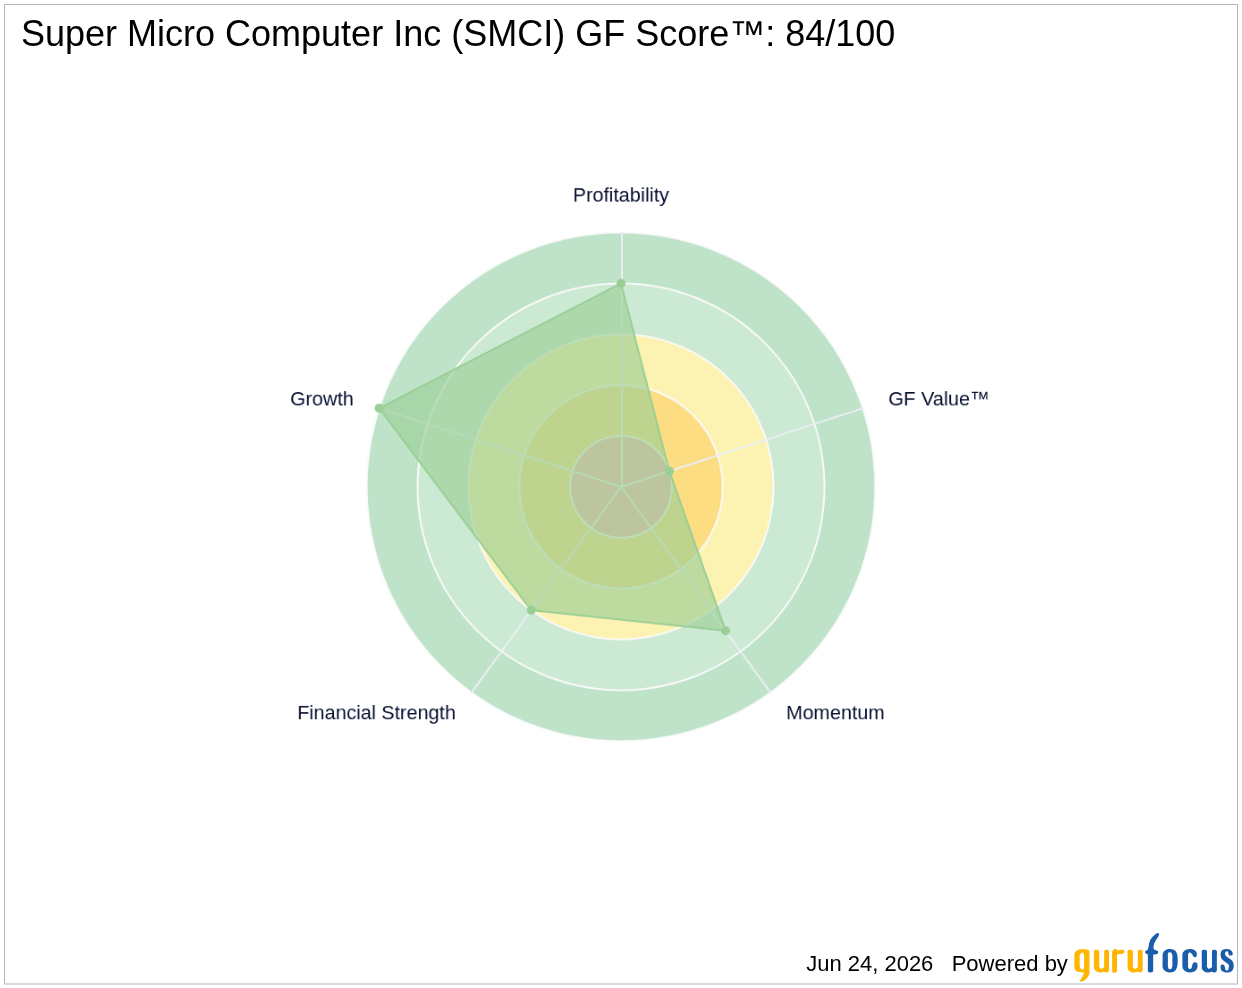
- GF Score™: 84/100, indicating strong overall performance
- Key financial signal: P/E (TTM) of 17.73x compared to a 5-Year Median P/E of 19.34x
What's Behind the News?
The announcement of Japan's economic development plan marks a significant pivot in the country's approach to economic growth, particularly in response to technological advancements and geopolitical tensions. By focusing on critical areas such as AI and semiconductors, the government aims to enhance economic security and resilience in supply chains. This initiative is expected to create a robust investment framework that combines public and private funding, with the government covering nearly half of the costs if inflation trends align with expectations.
In this context, Super Micro Computer Inc SMCI operates as a key player in the technology sector, providing high-performance server technology services to various markets, including cloud computing and high-performance computing. With a market capitalization of approximately $21.68 billion, SMCI is well-positioned to benefit from increased investments in AI and semiconductor technologies, aligning with the broader economic goals outlined by the Japanese government.
Is SMCI Overvalued or Undervalued?
According to GuruFocus, SMCI has a GF Value™ of $86.77, which indicates that the stock is currently undervalued by 61.4%, trading at $33.51. This significant margin of safety suggests that investors may have an opportunity to acquire shares at a discount relative to their intrinsic value. The current P/E (TTM) of 17.73x is lower than the 5-Year Median P/E of 19.34x, further supporting the notion that the stock may be undervalued. For more details, visit the GF Value™ page.
What Does SMCI's GF Score™ Tell Us?
The GF Score™ ranks stocks from 0 to 100 based on five key aspects: Financial Strength, Profitability, Growth, Valuation, and Momentum. Stocks with higher GF Score™ values have been found to generate higher long-term returns (backtested 2006-2021).
| Metric | Rating |
|---|---|
| GF Score™ | 84 |
| Financial Strength | 6/10 |
| Profitability | 8/10 |
| Growth | 10/10 |
| Valuation | 2/10 |
| Momentum | 7/10 |
SMCI's strengths lie in its high growth potential and solid profitability, as indicated by its top-ranking growth score of 10/10. However, the valuation rank of 2/10 suggests that while the stock may be undervalued based on GF Value™, investors should proceed with caution. For further insights, visit the SMCI stock page.
What Are Insiders Doing with SMCI Stock?
There has been no insider buying or selling activity reported for SMCI in the last three months, indicating a stable insider sentiment towards the stock.
What This Means for Investors
In summary, SMCI appears to be a potentially undervalued stock with a strong GF Score™ of 84, indicating solid fundamentals and growth prospects. However, the low valuation rank suggests that investors should carefully consider the risks before making investment decisions. For the complete analysis, visit the SMCI stock page. You can also use the GuruFocus Stock Screener to find similar opportunities.
Frequently Asked Questions
What is SMCI's GF Score™?
SMCI's GF Score™ is 84/100, indicating strong overall performance based on various financial metrics.
Is SMCI overvalued or undervalued?
SMCI is currently undervalued, with a GF Value™ of $86.77 compared to its current price of $33.51, representing a 61.4% discount.
What is SMCI's P/E ratio compared to historical?
SMCI's current P/E (TTM) is 17.73x, which is lower than its 5-Year Median P/E of 19.34x, suggesting potential undervaluation.
This stock alert was generated using automated technology and GuruFocus financial data to provide readers with timely and accurate market reporting. This content was reviewed by GuruFocus editorial team prior to publication. Please send any questions or comments about this story to [email protected].

