


On June 29, 2026, Kopin Corp KOPN announced the acquisition of several new orders as clients assess its Sentinel First Person Viewer (FPV) product for integration into the U.S. Government’s one-way attack drone initiative. This surge in demand particularly stems from clients involved in the Drone Dominance Program, who are opting for Kopin's domestically produced Sentinel FPV for advanced drone systems.
- Market Cap: $706.92 million
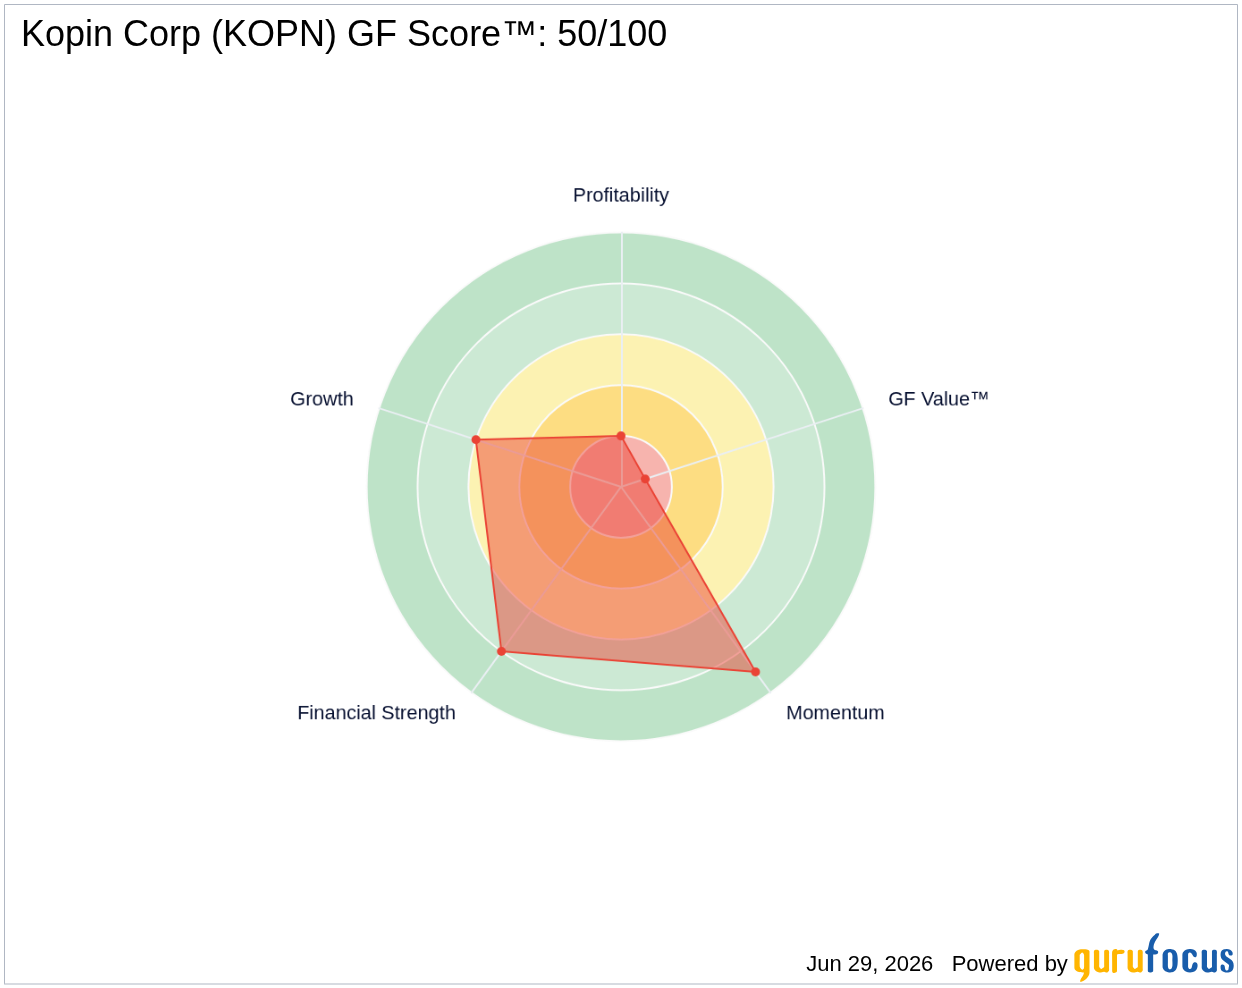
- GF Score™: 50/100, indicating average performance across key metrics
- Insider Activity: $1.8 million sold in the last three months
What's Behind the News?
The announcement of new orders for Kopin's Sentinel FPV product marks a significant milestone for the company, as it aligns with the U.S. Government's initiatives in drone technology. The CEO emphasized that these prototype orders validate the effectiveness of their dual-situational-awareness technology, showcasing Kopin's commitment to developing reliable, defense-ready products within the U.S. market. The partnerships formed through this initiative have the potential to evolve into substantial volume opportunities, allowing the company to remain agile in meeting the growing demands of the defense sector.
Kopin Corp operates within the technology sector, specifically in the hardware industry, focusing on innovative display and optical solutions. With a market capitalization of approximately $706.92 million, the company offers a diverse portfolio that includes micro displays, display modules, and head-mounted display systems. Geographically, Kopin derives a majority of its revenue from the Americas, with additional presence in Asia-Pacific and Europe.
How Is KOPN Valued?
Currently, GF Value™ data is not available for Kopin Corp. However, the company's P/E ratio stands at an extraordinarily high 381.5x, indicating that the stock may be significantly overvalued compared to its earnings. This high valuation could be a concern for potential investors, especially considering the company's financial performance metrics. For more detailed valuation insights, visit the KOPN stock page.
What Does KOPN's GF Score™ Tell Us?
The GF Score™ ranks stocks from 0 to 100 based on five key aspects: Financial Strength, Profitability, Growth, Valuation, and Momentum. Stocks with higher GF Score™ values have been found to generate higher long-term returns (backtested 2006-2021).
| Metric | Rating |
|---|---|
| GF Score™ | 50 |
| Financial Strength | 8/10 |
| Profitability | 2/10 |
| Growth | 6/10 |
Kopin Corp's GF Score™ of 50 suggests that the company is performing at an average level relative to its peers. The strong financial strength rating of 8/10 indicates a solid balance sheet, while the low profitability rank of 2/10 reflects challenges in generating consistent profits. The growth rank of 6/10 suggests some potential for improvement in revenue growth. For more detailed insights, visit the KOPN stock page.
What Are Insiders Doing with KOPN Stock?
In the past three months, there have been insider selling transactions amounting to $1.8 million, with no insider buying reported during the same period. This trend may raise concerns among investors regarding the confidence of insiders in the company's future performance.
What This Means for Investors
The recent surge in orders for Kopin's FPV product is a positive development that could enhance the company's growth prospects in the defense sector. However, the high P/E ratio and insider selling activity may signal caution for potential investors. Overall, the mixed signals from the GF Score™ and financial metrics suggest that investors should conduct thorough research before making any decisions. For the complete analysis, visit the KOPN stock page. You can also use the GuruFocus Stock Screener to find similar opportunities.
Frequently Asked Questions
What is KOPN's GF Score™?
KOPN's GF Score™ is 50/100, indicating average performance across key financial metrics.
How is KOPN valued?
KOPN has a P/E ratio of 381.5x, suggesting that the stock may be significantly overvalued compared to its earnings.
What is KOPN's P/E ratio compared to historical?
The current P/E ratio of 381.5x is extraordinarily high, indicating potential overvaluation, especially in light of the company's financial performance metrics.
This stock alert was generated using automated technology and GuruFocus financial data to provide readers with timely and accurate market reporting. This content was reviewed by GuruFocus editorial team prior to publication. Please send any questions or comments about this story to [email protected].

