

On June 29, 2026, Gorilla Technology Group GRRR shares increased by nearly 4% in premarket trading following an announcement of anticipated revenue for Q2 2026, projected to exceed $44 million. This figure surpasses the consensus estimate of $33.25 million.
- Market Cap: $547.75 million
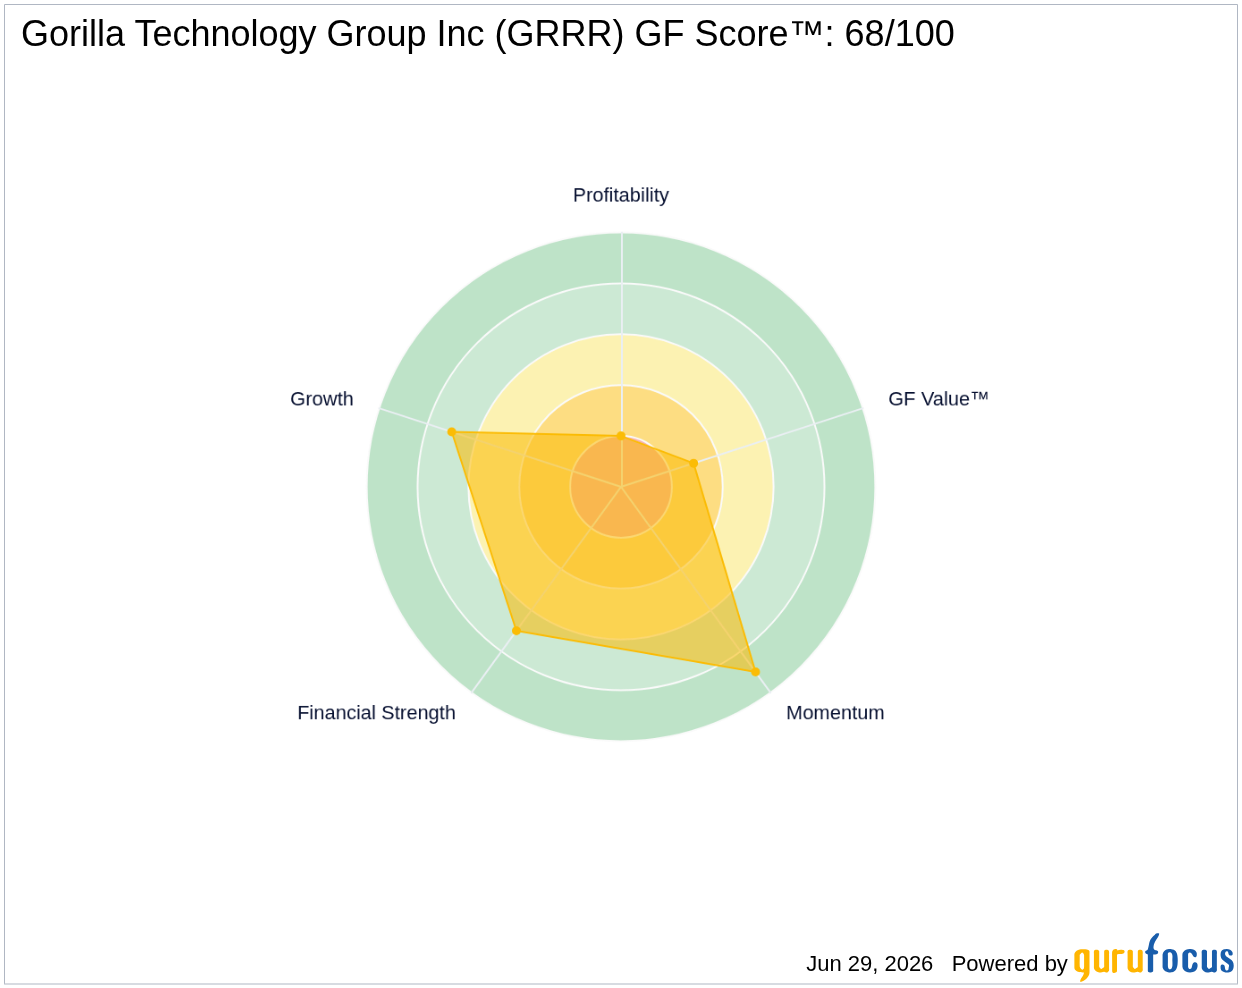
- GF Score™: 68/100, indicating a solid overall performance relative to peers
- Insider Activity: $0.2 million sold by insiders in the last three months
What's Behind the News?
The recent surge in Gorilla Technology Group's stock price is primarily attributed to its optimistic revenue forecast for Q2 2026, which is expected to exceed $44 million. This projection represents a significant sequential growth of over 55% from Q1 2026 and more than 100% year-over-year growth compared to Q2 2025's revenue of $21.1 million. The company has highlighted that this positive outlook is driven by ongoing customer contracts and effective revenue conversion from commercial commitments, showcasing its ability to capitalize on market opportunities.
Gorilla Technology Group Inc operates in the technology sector, specifically within the software industry. The company specializes in providing information, software, and data processing services, focusing on video intelligence, Internet of Things (IoT) security, edge AI data analytics, and operational technology (OT) security solutions. With a market capitalization of $547.75 million, Gorilla Technology Group is positioned to leverage its innovative products and services to enhance urban operations and optimize digital transformation.
How Is GRRR Valued?
While GF Value™ data is not available for Gorilla Technology Group, the company's current valuation can be assessed through its price-to-sales (P/S) ratio of 4.27. This ratio indicates how much investors are willing to pay for each dollar of sales, which can be a useful metric in evaluating growth-oriented companies. Given the significant revenue growth expectations, investors may find the current P/S ratio appealing, especially in the context of the company's growth trajectory. For more details, visit the GRRR stock page.
What Does GRRR's GF Score™ Tell Us?
The GF Score™ ranks stocks from 0 to 100 based on five key aspects: Financial Strength, Profitability, Growth, Valuation, and Momentum. Stocks with higher GF Score™ values have been found to generate higher long-term returns (backtested 2006-2021).
| Metric | Rating |
|---|---|
| GF Score™ | 68 |
| Financial Strength | 7/10 |
| Profitability | 2/10 |
| Growth | 7/10 |
The strengths of Gorilla Technology Group lie in its financial strength and growth potential, as indicated by its GF Score™ of 68. However, the company faces challenges in profitability, which is reflected in its low profitability rank of 2/10. This combination suggests that while the company is positioned for growth, it must address its profitability issues to enhance shareholder value. For further insights, visit the GRRR stock page.
What Are Insiders Doing with GRRR Stock?
In the last three months, there has been insider activity with a total of $0.2 million worth of shares sold by insiders. Notably, there have been no insider purchases during this period, which may raise questions about insider confidence in the company's future performance.
What This Means for Investors
Gorilla Technology Group's strong revenue projections and solid GF Score™ indicate a company with growth potential, despite its current profitability challenges. Investors should consider these factors alongside insider activity and market conditions when evaluating the stock's potential.
For the complete analysis, visit the GRRR stock page. You can also use the GuruFocus Stock Screener to find similar opportunities.
Frequently Asked Questions
What is GRRR's GF Score™?
GRRR's GF Score™ is 68/100, indicating a solid overall performance relative to its peers.
How is GRRR valued?
GRRR has a price-to-sales (P/S) ratio of 4.27, reflecting investor sentiment towards its growth potential.
What is GRRR's P/E ratio compared to historical?
Currently, GRRR does not have a P/E ratio available, but its financial strength is indicated by a strong Altman Z-score of 3.1.
This stock alert was generated using automated technology and GuruFocus financial data to provide readers with timely and accurate market reporting. This content was reviewed by GuruFocus editorial team prior to publication. Please send any questions or comments about this story to [email protected].

