

On June 30, 2026, Patrick Industries PATK and LCI Industries (LCII) announced an all-stock merger aimed at creating a larger component solutions provider for the housing, transportation, and outdoor sectors. This merger is projected to generate annual synergies exceeding $150 million.
- Patrick Industries has a market cap of approximately $3.07 billion.
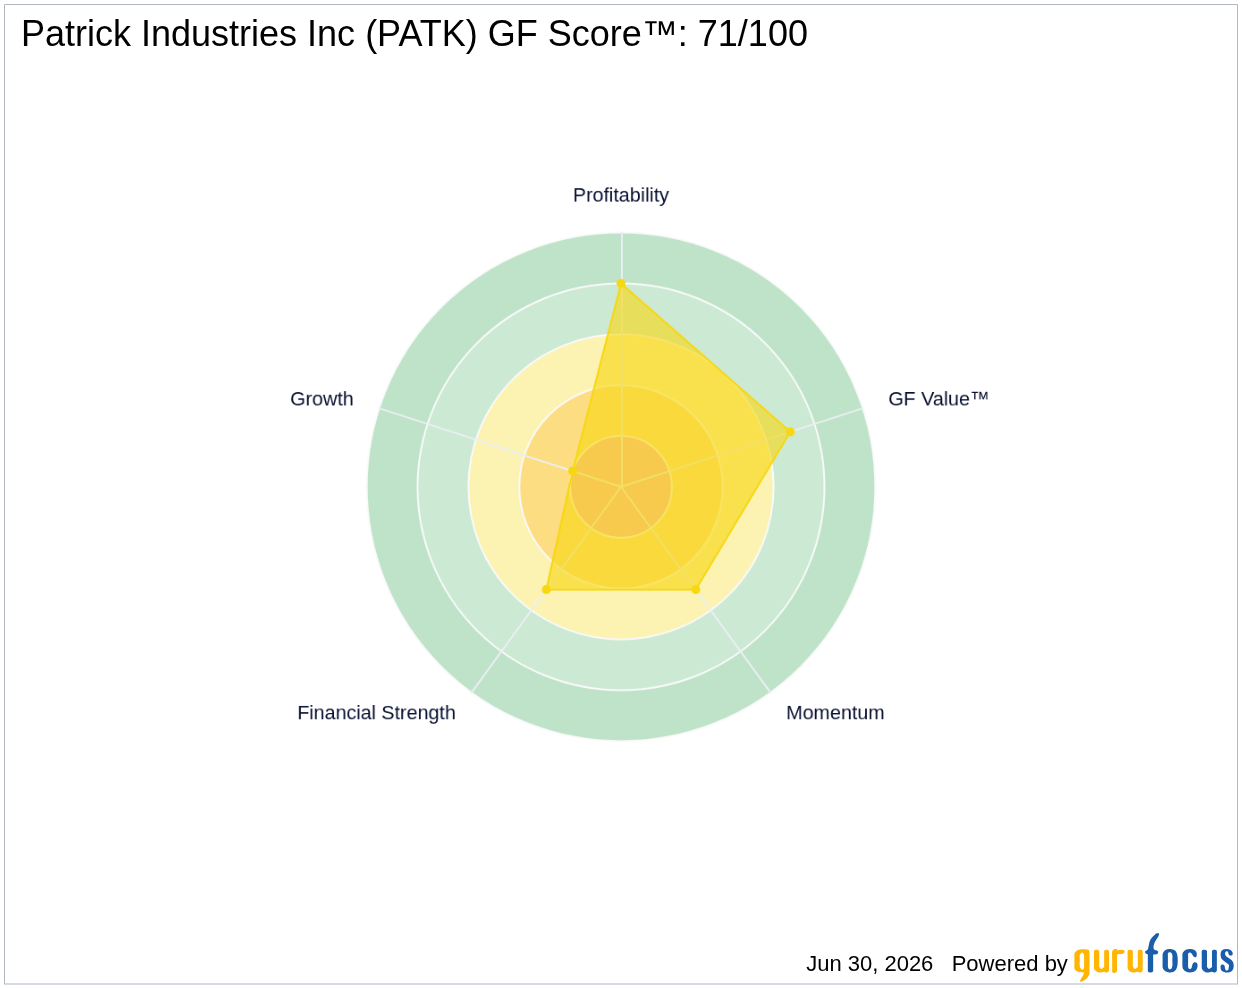
- GF Score™: 71/100, indicating a solid overall performance relative to peers.
- Insider activity shows a positive trend, with 8 insider buying transactions over the past three months.
What's Behind the News?
The merger between Patrick Industries and LCI Industries marks a significant consolidation in the component solutions market, particularly for sectors such as housing and transportation. By combining their resources, the two companies aim to enhance their product offerings and operational efficiencies, which could lead to improved profitability and market share. The all-stock agreement stipulates that LCI shareholders will receive 1.2440 shares of Patrick stock for each LCI share, resulting in Patrick shareholders owning approximately 52% of the new entity, while LCI shareholders will hold about 48%.
Patrick Industries operates primarily in the Consumer Cyclical sector, specifically within the Vehicles & Parts industry. The company is known for providing component solutions across various markets, including recreational vehicles, marine, and manufactured housing. With a revenue of approximately $3.94 billion, Patrick Industries has established itself as a key player in its industry, focusing on manufacturing and distributing essential components for various applications.
How Is PATK Valued?
Currently, GF Value™ data is not available for Patrick Industries. However, the company's P/E ratio stands at 23.92, which is close to its 1-year low of 21.83. This suggests that the stock may be fairly valued in the current market context. Investors should consider this valuation alongside the company's growth potential and profitability metrics. For more detailed information, visit the PATK stock page.
What Does PATK's GF Score™ Tell Us?
The GF Score™ ranks stocks from 0 to 100 based on five key aspects: Financial Strength, Profitability, Growth, Valuation, and Momentum. Stocks with higher GF Score™ values have been found to generate higher long-term returns (backtested 2006-2021).
| GF Score™ | 71 |
| Financial Strength | 5/10 |
| Profitability | 8/10 |
| Growth | 2/10 |
| Valuation | Fairly Valued |
Patrick Industries demonstrates strong profitability with a rank of 8/10, indicating solid margins and operational efficiency. However, its growth rank of 2/10 suggests challenges in expanding revenue streams, which could be a concern for long-term investors. The financial strength rating of 5/10 reflects a balanced approach to managing debt and assets. For further insights, visit the PATK stock page.
What Are Insiders Doing with PATK Stock?
Recent insider activity indicates a positive sentiment towards Patrick Industries, with 8 insider buying transactions recorded over the past three months, totaling 28,700 shares purchased. This trend may signal confidence in the company's future prospects following the merger announcement.
What This Means for Investors
The merger between Patrick Industries and LCI Industries presents a strategic opportunity for both companies to enhance their market position and operational efficiencies. With a GF Score™ of 71/100 and strong profitability metrics, Patrick Industries appears to be a solid player in its sector. However, potential investors should remain cautious of the company's growth challenges and monitor how the merger impacts its financial performance moving forward. For the complete analysis, visit the PATK stock page. You can also use the GuruFocus Stock Screener to find similar opportunities.
Frequently Asked Questions
What is PATK's GF Score™?
PATK's GF Score™ is 71/100, indicating a solid overall performance relative to its peers, particularly in profitability.
How is PATK valued?
Patrick Industries has a P/E ratio of 23.92, which is close to its 1-year low, suggesting that it may be fairly valued in the current market context.
What is PATK's P/E ratio compared to historical?
The current P/E ratio of 23.92 is near its 1-year low of 21.83, indicating that the stock may be trading at a reasonable valuation compared to its historical performance.
This stock alert was generated using automated technology and GuruFocus financial data to provide readers with timely and accurate market reporting. This content was reviewed by GuruFocus editorial team prior to publication. Please send any questions or comments about this story to [email protected].

