


On July 01, 2026, AstraZeneca PLC AZN shares fell 3.0% today to a current price of $183.86. This decline occurred within a 52-week range of $134.90 to $212.71, highlighting the volatility in the stock's performance over the past year.
- GF Value™ verdict: The current price is $183.86, which is 1.9% above the GF Value™ of $180.39, indicating that the stock is overvalued.
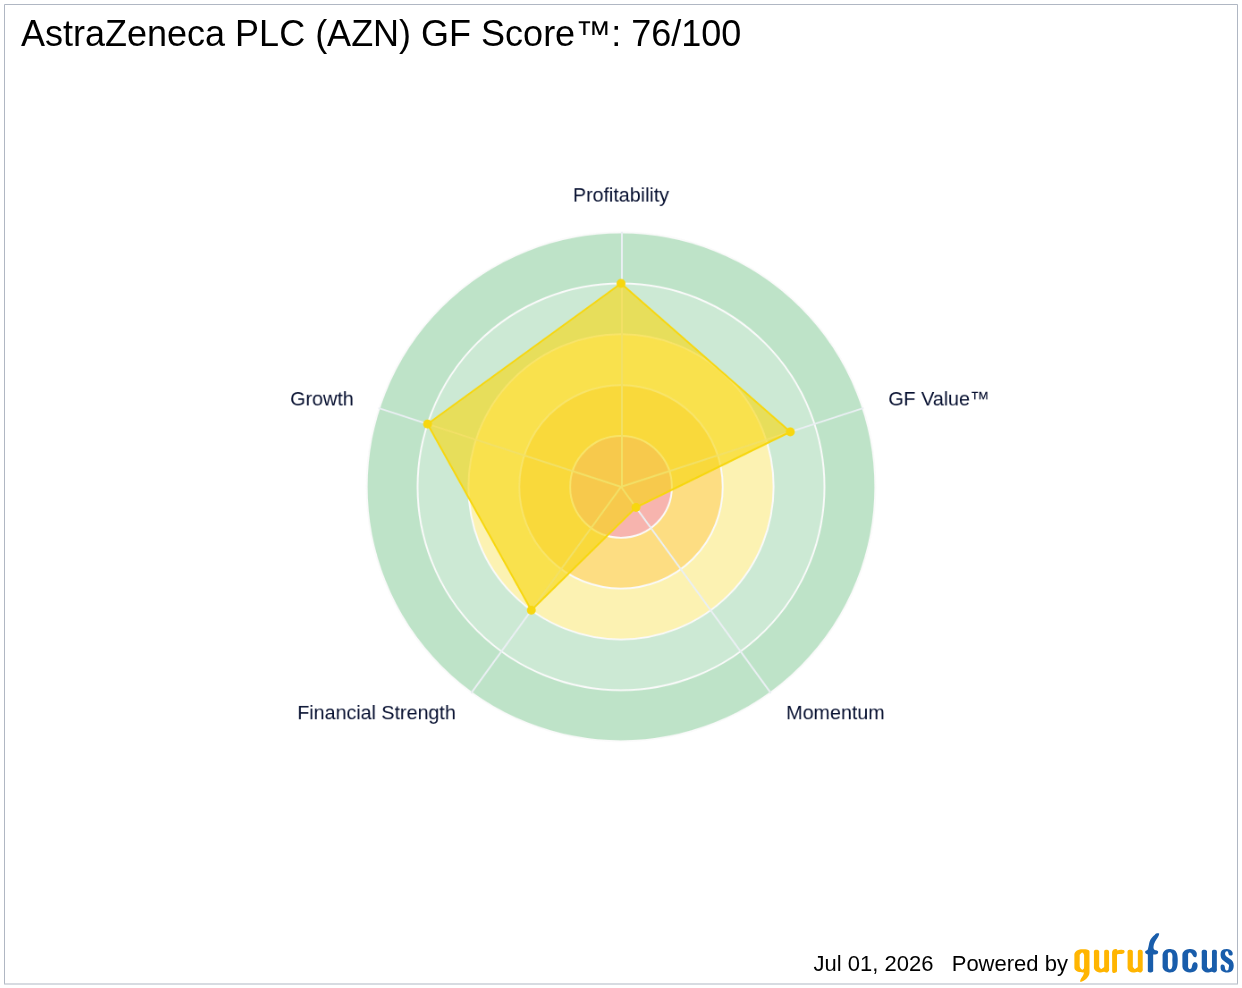
- GF Score™: AZN has a GF Score™ of 76/100, which classifies it as above average.
- Most notable signal: Insider activity has shown that insiders sold $2.2 million worth of stock in the last three months, with no buying activity reported.
Is AZN Overvalued or Undervalued?
The current price of AstraZeneca PLC AZN at $183.86 is slightly above the GF Value™ of $180.39, suggesting that the stock is 1.9% overvalued. This overvaluation indicates a lack of margin of safety for potential investors, as the price exceeds the intrinsic value determined by GuruFocus. Under such circumstances, caution may be warranted given the risk of a price correction. The GF Valuation label classifies the stock as fairly valued based on its intrinsic value measurements. GF Value™ is GuruFocus' proprietary measure of intrinsic value, calculated from historical trading multiples, past business growth, and future performance estimates.
Being overvalued could imply that the market has high expectations for AstraZeneca's future performance, which may not be realized. Investors should remain vigilant about market conditions that might affect the stock's valuation.
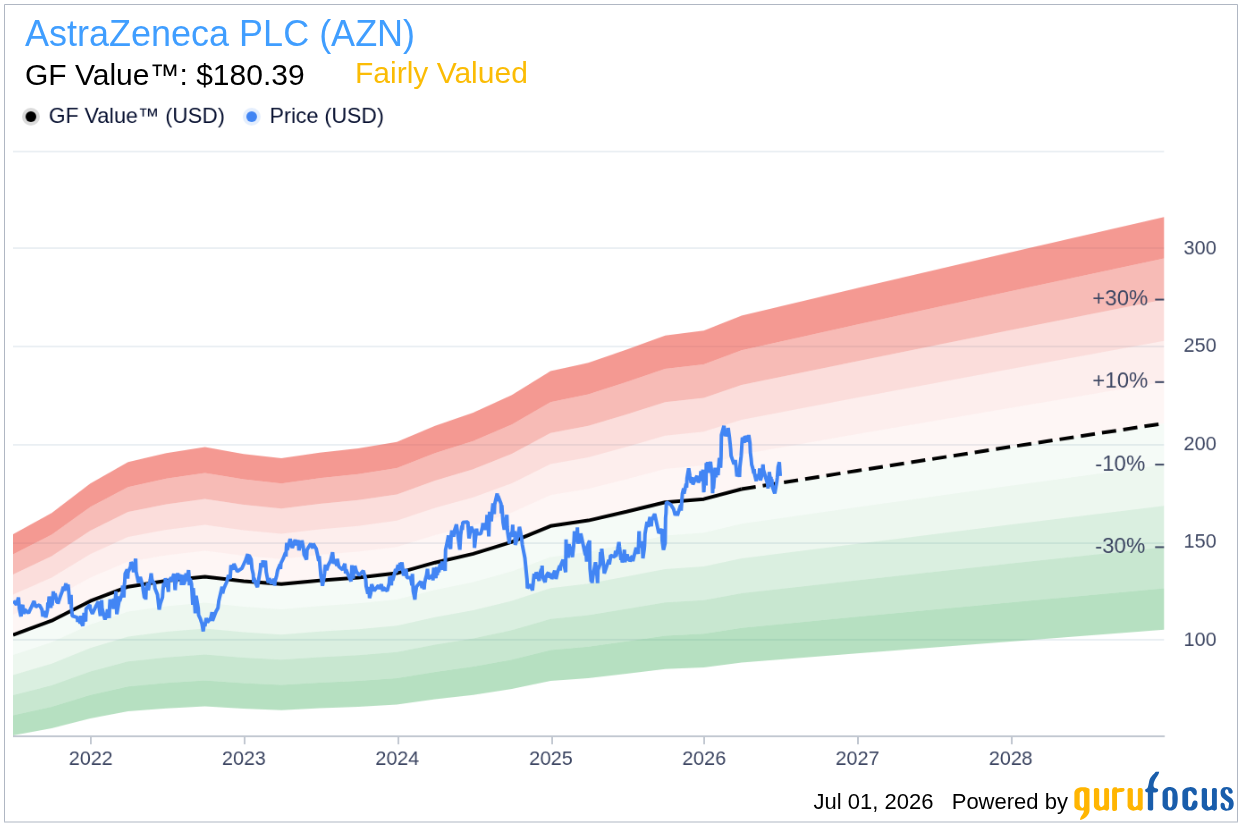
How Does AZN's Valuation Compare to Its History?
| Metric | Current | Historical |
|---|---|---|
| P/E (TTM) | 27.6x | 34.0x |
| Forward P/E | 17.8x | - |
AstraZeneca's current P/E (TTM) of 27.6x is significantly below its 5-year median P/E of 34.0x, reflecting a 19% discount to its historical valuation. This discrepancy between the current valuation and the historical P/E metrics aligns with the GF Value™ verdict, which indicates that the stock is currently overvalued. The lower current P/E may suggest that while the stock has room to grow, it is still trading at a premium compared to its historical averages.
What Does AZN's GF Score™ Tell Us?
| Metric | Rating |
|---|---|
| GF Score™ | 76 |
| Financial Strength | 6/10 |
| Profitability | 8/10 |
| Growth | 8/10 |
| Valuation | 7/10 |
| Momentum | 1/10 |
The GF Score™ of 76/100 reflects an above-average rating, indicating that AstraZeneca has strengths in profitability and growth, both rated at 8/10. However, the momentum rank is notably low at 1/10, suggesting that the stock may not be experiencing positive price movement in the near term. The financial strength rating of 6/10 indicates a moderate level of stability, while the valuation rank of 7/10 suggests that the stock is reasonably valued relative to its earnings potential. Together, these scores highlight a company with solid fundamentals but lackluster recent performance.
What Are Insiders Doing with AZN Stock?
In the last three months, insiders at AstraZeneca have sold $2.2 million worth of shares, with no reported purchases. This pattern of selling could signal a lack of confidence among insiders regarding the stock's future performance, which may be a concern for potential investors. The absence of insider buying further underscores the cautious sentiment surrounding the stock.
What This Means for Investors
Based on the GF Value™ assessment, AstraZeneca PLC AZN appears to be overvalued at the current price of $183.86. With the stock trading above its estimated fair value of $180.39, potential investors may need to exercise caution and consider the associated risks before making investment decisions.
For the complete analysis, visit the AstraZeneca PLC AZN stock page. You can also explore the GF Value™ page for detailed valuation methodology, or use the GuruFocus Stock Screener to find similar opportunities.
Frequently Asked Questions
What is AZN's GF Score™?
AstraZeneca's GF Score™ is 76/100, indicating an above-average ranking based on various factors that are associated with long-term returns.
Is AZN overvalued or undervalued?
AZN is currently overvalued, with a GF Value™ of $180.39 compared to its current price of $183.86.
What is AZN's P/E ratio?
The P/E ratio for AZN is 27.6x, which is significantly below its 5-year median P/E of 34.0x, indicating that the stock is trading at a discount relative to its historical valuation.
This stock alert was generated using automated technology and GuruFocus financial data to provide readers with timely and accurate market reporting. This content was reviewed by GuruFocus editorial team prior to publication. Please send any questions or comments about this story to [email protected].

