

On July 02, 2026, investor Michael Burry (Trades, Portfolio), renowned for his role in "The Big Short," disclosed a short position on Micron Technology Inc MU in a recent Substack article. Burry emphasized the cyclical nature of Micron, asserting that it exemplifies extreme volatility in the market.
- GF Value™ verdict: Current Price $975.56 vs GF Value™ $489.27 = 99.4% overvalued
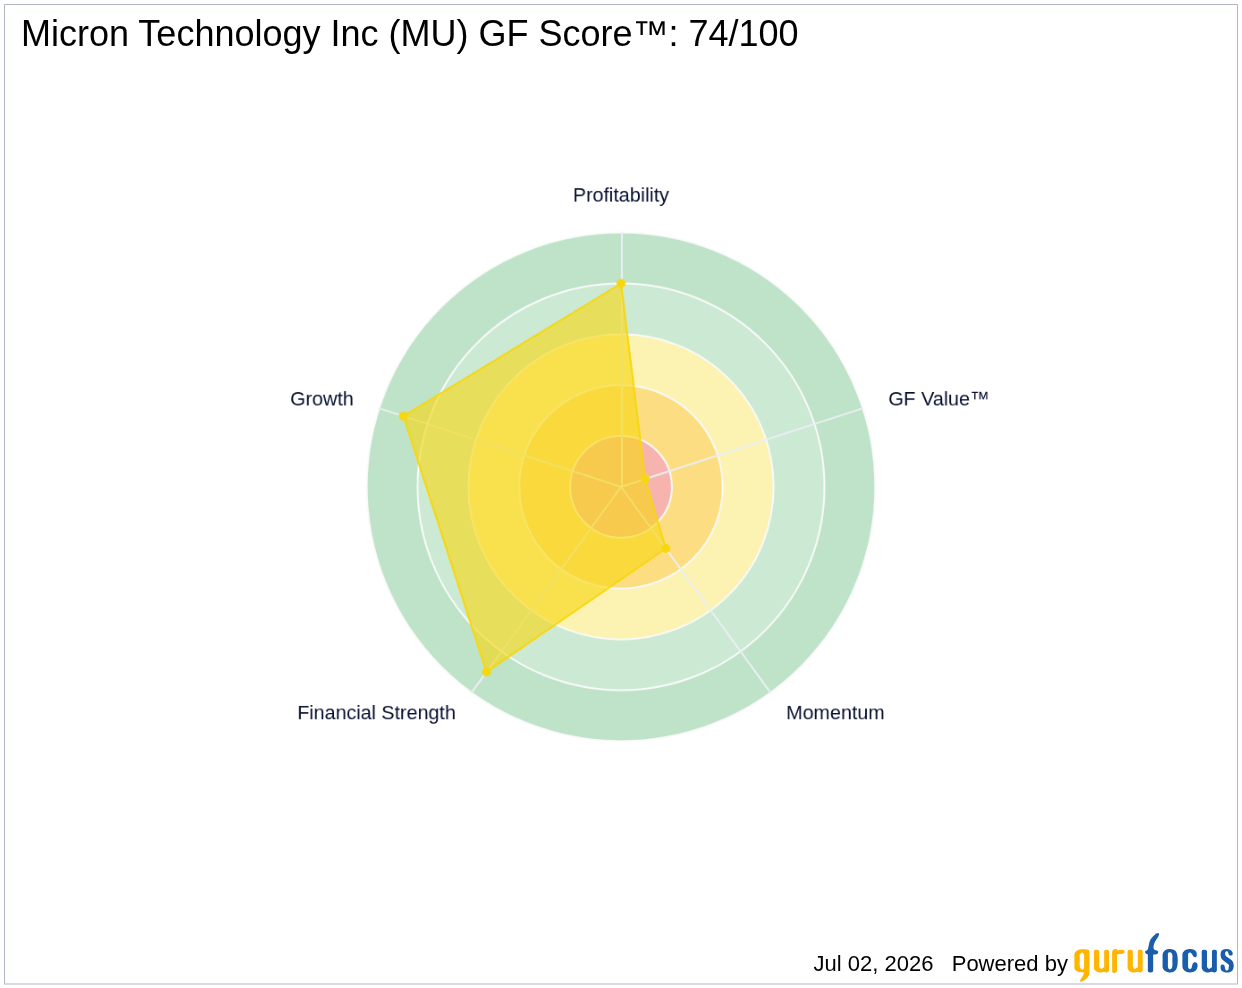
- GF Score™: 74/100, indicating a solid but cautious investment profile
- Insider activity: Sold $124.9M worth of shares in the last 3 months
What's Behind the News?
Michael Burry (Trades, Portfolio)'s decision to short Micron Technology highlights his concerns regarding the company's performance in a volatile market. Burry pointed out that Micron is the only pure play on dynamic random-access memory (DRAM) among major U.S. exchanges, which has led to significant price inflation during economic booms and steep declines during downturns. This strategic move reflects a cautious approach to navigating the current market landscape, especially given the cyclical nature of the semiconductor industry.
Micron Technology Inc is one of the largest semiconductor companies globally, specializing in memory and storage chips. The company primarily generates revenue from DRAM, with additional exposure to NAND flash chips. Micron serves a diverse global customer base, providing chips for data centers, mobile phones, consumer electronics, and industrial applications. With a market capitalization of approximately $1.1 trillion, Micron operates within the technology sector, specifically in the semiconductors industry.
Is MU Overvalued or Undervalued?
According to GuruFocus, Micron Technology Inc has a GF Value™ of $489.27, which indicates that the stock is currently trading at a significant premium, with a current price of $975.56, marking it as 99.4% overvalued. This substantial gap suggests that investors may be paying too much for the stock relative to its intrinsic value, indicating a lack of margin of safety for potential investors. The P/E ratio (TTM) stands at 22.09x, which is above the 5-year median P/E of 20.66x, further supporting the notion of overvaluation. For more details, visit the GF Value™ page.
What Does MU's GF Score™ Tell Us?
The GF Score™ ranks stocks from 0 to 100 based on five key aspects: Financial Strength, Profitability, Growth, Valuation, and Momentum. Stocks with higher GF Score™ values have been found to generate higher long-term returns (backtested 2006-2021).
| Metric | Rating |
|---|---|
| GF Score™ | 74 |
| Financial Strength | 9/10 |
| Profitability | 8/10 |
| Growth | 9/10 |
| Valuation | 1/10 |
| Momentum | 3/10 |
Micron Technology's strengths lie in its financial strength, profitability, and growth, which are rated 9/10, 8/10, and 9/10, respectively. However, the company's valuation rank is concerning at 1/10, indicating that it is significantly overvalued in the current market. For further insights, visit the MU stock page.
What Are Insiders Doing with MU Stock?
In the past three months, insider activity has shown a significant sell-off, with insiders selling shares worth $124.9 million. This trend may reflect a lack of confidence in the stock's current valuation and future performance.
What This Means for Investors
The current analysis indicates that Micron Technology Inc is significantly overvalued based on its GF Value™ and P/E metrics. Investors should exercise caution and consider the implications of insider selling and the company's cyclical nature before making investment decisions. For the complete analysis, visit the MU stock page. You can also use the GuruFocus Stock Screener to find similar opportunities.
Frequently Asked Questions
What is MU's GF Score™?
MU's GF Score™ is 74/100, indicating a solid investment profile with strengths in financial health and growth.
Is MU overvalued or undervalued?
MU is currently overvalued, with a GF Value™ of $489.27 compared to its current price of $975.56, marking it as 99.4% overvalued.
What is MU's P/E ratio compared to historical?
MU's P/E ratio (TTM) is 22.09x, which is higher than its 5-year median P/E of 20.66x, suggesting that the stock is overvalued based on historical performance.
Also check out:This stock alert was generated using automated technology and GuruFocus financial data to provide readers with timely and accurate market reporting. This content was reviewed by GuruFocus editorial team prior to publication. Please send any questions or comments about this story to [email protected].

