

On July 05, 2026, Goldman Sachs indicated that the USD/JPY exchange rate will likely face upward pressure unless the U.S. economy experiences an unexpected downturn or the Bank of Japan adopts a more aggressive monetary tightening stance. The firm has raised its one-year forecast for USD/JPY from 155 to 165, with three-month and six-month targets adjusted to 162 and 163, respectively. Stock Ticker: USD
- GF Value™ verdict: $74.79 vs Current Price $87.51 = 17.0% overvalued
- GF Score™: 91/100, indicating strong overall performance
- Key financial signal: P/E (TTM) at 35.06x
What's Behind the News?
The recent adjustments by Goldman Sachs reflect ongoing economic conditions that are influencing currency valuations globally. Analysts, including Kamakshya Trivedi, noted that sustained high U.S. yields, a low risk of recession, and ongoing fiscal concerns are contributing to the depreciation pressure on the yen. The Bank of Japan's slow interest rate increases further exacerbate this situation, making the yen less attractive compared to the dollar.
In this context, the ProShares Ultra Semiconductors 2X Shares USD operates within the semiconductor sector, which has seen significant growth and volatility in recent years. With a market capitalization of approximately $2.63 billion, the fund aims to provide investors with leveraged exposure to the semiconductor industry, capitalizing on the growing demand for technology and innovation.
Is USD Overvalued or Undervalued?
According to GuruFocus, the GF Value™ for USD is calculated at $74.79, while its current trading price is $87.51, indicating that the stock is approximately 17.0% overvalued. This overvaluation suggests that investors may be paying a premium for the stock compared to its intrinsic value, which could pose risks if market conditions shift.
The P/E (TTM) ratio for USD stands at 35.06x, which may be considered high, especially in comparison to historical averages for similar funds. This elevated P/E ratio could indicate that the stock is priced for high growth, which may not be sustainable in the long term. For more details, visit the GF Value™ page.
What Does USD's GF Score™ Tell Us?
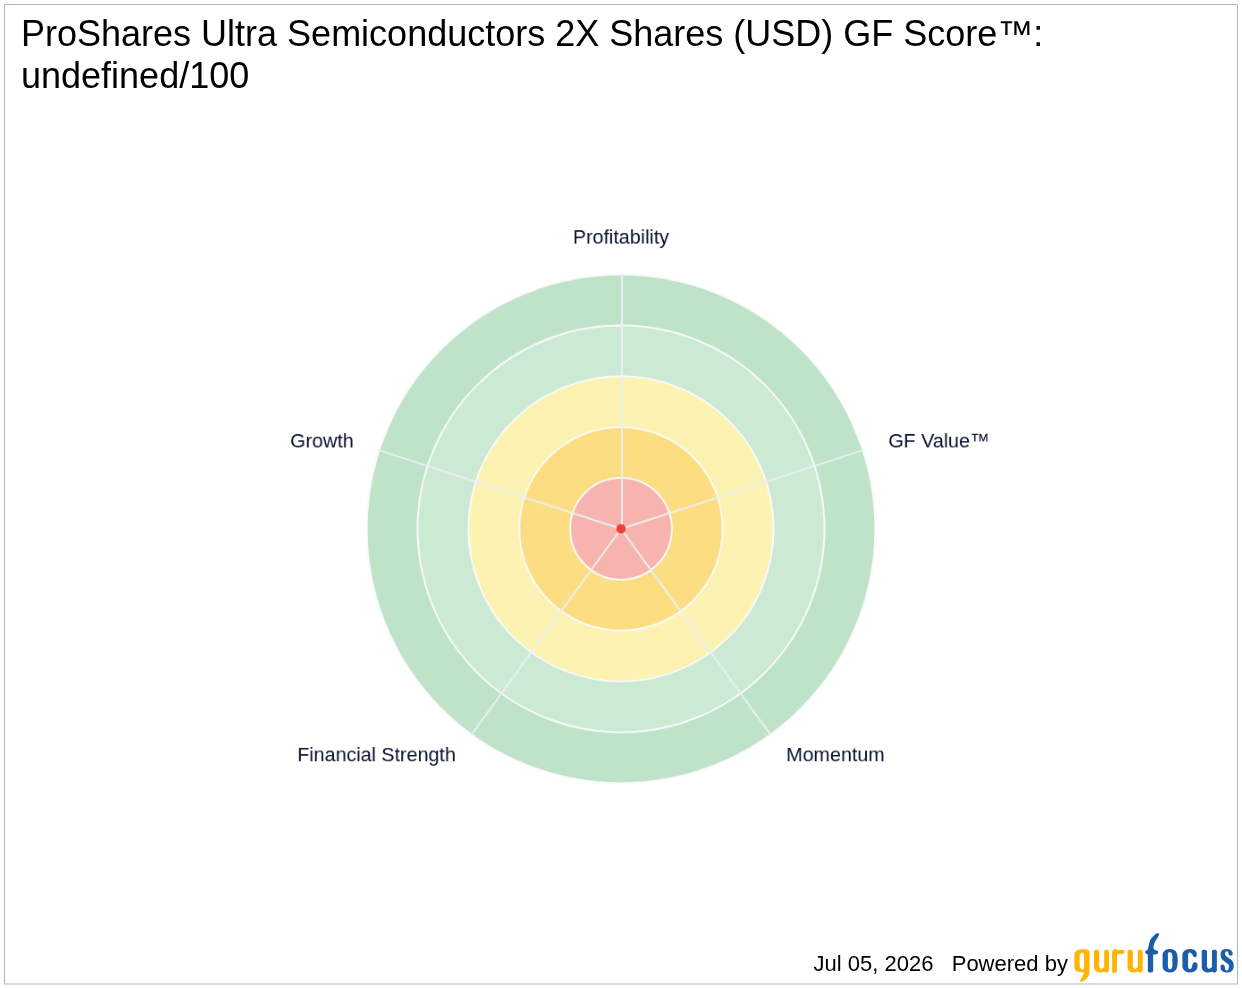
The GF Score™ ranks stocks from 0 to 100 based on five key aspects: Financial Strength, Profitability, Growth, Valuation, and Momentum. Stocks with higher GF Score™ values have been found to generate higher long-term returns (backtested 2006-2021).
| Metric | Rating |
|---|---|
| GF Score™ | 91 |
| Financial Strength | 8/10 |
| Profitability | 9/10 |
| Growth | 10/10 |
| Momentum | 9/10 |
USD's high GF Score™ of 91 indicates strong financial health and growth potential, with particularly high rankings in profitability and growth. However, the valuation rank of 4/10 suggests that investors should exercise caution regarding its current price relative to its intrinsic value. For more insights, check the USD stock page.
What Are Insiders Doing with USD Stock?
There has been no insider buying or selling activity reported for USD in the last three months, indicating a potential lack of confidence or uncertainty among insiders regarding the stock's future performance.
What This Means for Investors
Given the current overvaluation of USD based on GF Value™ and the high P/E ratio, investors may want to proceed with caution. While the strong GF Score™ reflects solid financial metrics, the valuation concerns suggest that the stock may not be an attractive buy at its current price level. For the complete analysis, visit the USD stock page. You can also use the GuruFocus Stock Screener to find similar opportunities.
Frequently Asked Questions
What is USD's GF Score™?
USD's GF Score™ is 91/100, indicating strong overall performance based on financial health, profitability, growth potential, and momentum.
Is USD overvalued or undervalued?
USD is currently overvalued by approximately 17.0%, with a GF Value™ of $74.79 compared to its current price of $87.51.
What is USD's P/E ratio compared to historical?
USD's P/E (TTM) ratio is 35.06x, which may be considered high, suggesting that the stock is priced for significant growth that may not be sustainable.
This stock alert was generated using automated technology and GuruFocus financial data to provide readers with timely and accurate market reporting. This content was reviewed by GuruFocus editorial team prior to publication. Please send any questions or comments about this story to [email protected].

