


On July 07, 2026, JPMorgan announced an optimistic outlook for Eli Lilly LLY as the company prepares to report its earnings in August. The firm has raised its price target for the stock from $130 to $140, indicating a potential upside of 17% from Monday's closing price. Analyst Chris Schott highlighted that continued international expansion of Mounjaro and robust growth in the U.S. obesity market will significantly contribute to the company's performance.
- GF Value™ verdict: Current Price $1200.06 vs GF Value™ $1419.69 = 15.5% undervalued
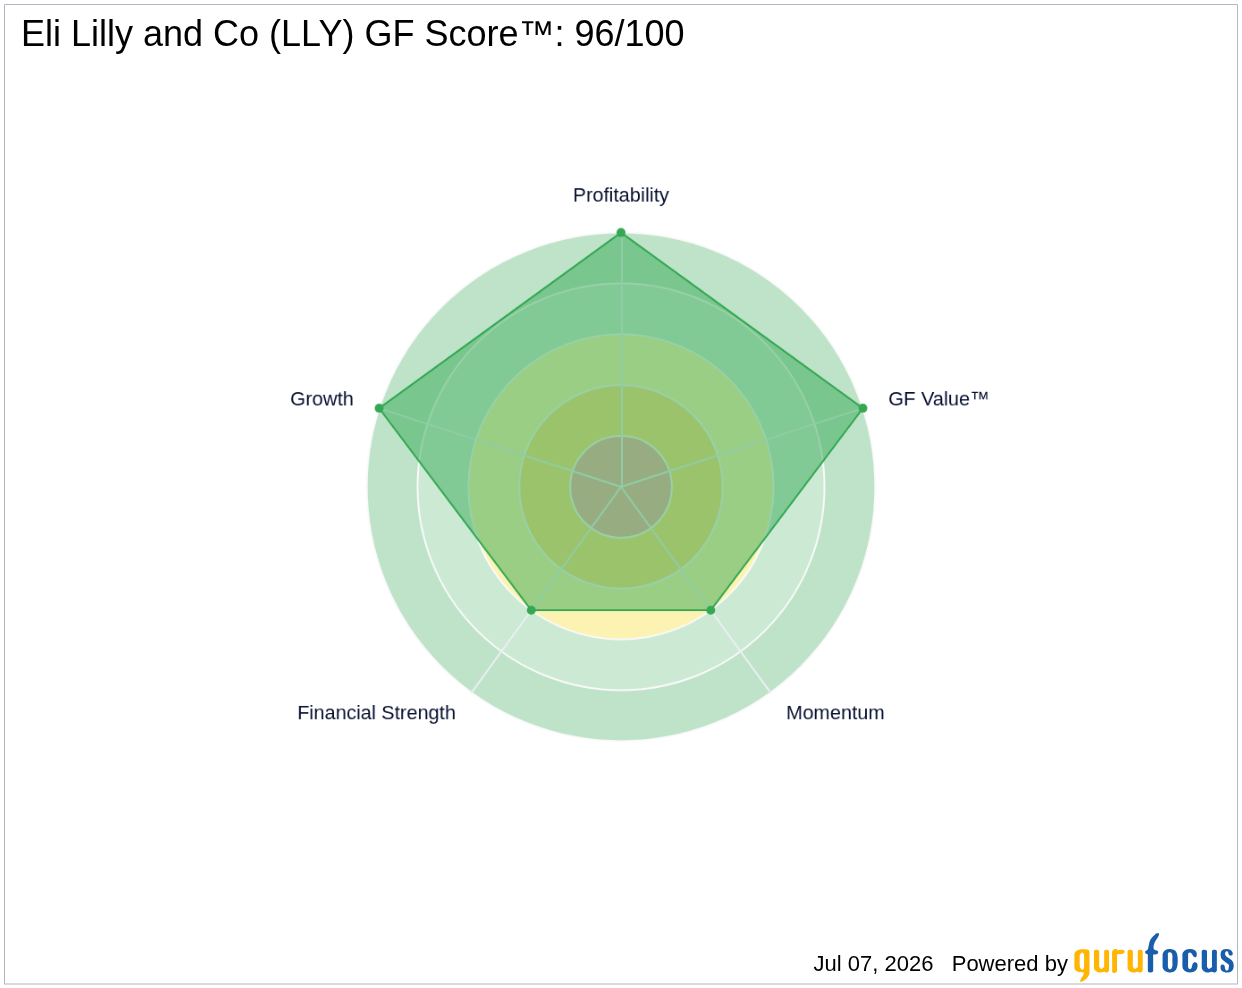
- GF Score™: 96/100, indicating strong overall performance
- Key financial signal: P/E (TTM) of 42.63x compared to a 5-year median P/E of 53.37x
What's Behind the News?
The recent price target increase by JPMorgan reflects confidence in Eli Lilly's growth trajectory, particularly in the obesity treatment segment. The firm anticipates total sales for the quarter to reach $20.7 billion, exceeding market consensus by approximately $300 million. Earnings per share are projected at $8.85, surpassing estimates by $0.13. This positive outlook is largely attributed to the success of Mounjaro and the best-selling obesity drug Zepbound, which have positioned Eli Lilly as a leader in the healthcare sector.
Eli Lilly and Co, with a market capitalization of approximately $1.07 trillion, operates in the healthcare sector, specifically within the drug manufacturing industry. The company focuses on developing treatments in neuroscience, cardiometabolic health, oncology, and immunology. Its diverse portfolio includes notable products such as Verzenio, Jaypirca, and Trulicity, which cater to a wide range of medical needs.
Is LLY Overvalued or Undervalued?
According to GuruFocus, Eli Lilly's GF Value™ is calculated at $1419.69, indicating that the stock is currently undervalued by approximately 15.5% based on its intrinsic value. This margin of safety suggests that investors may have an opportunity to acquire shares at a favorable price relative to the company's true worth. The current P/E (TTM) ratio stands at 42.63x, which is significantly lower than its 5-year median P/E of 53.37x, suggesting that the stock may be undervalued compared to its historical performance. For more details, visit the GF Value™ page.
What Does LLY's GF Score™ Tell Us?
The GF Score™ ranks stocks from 0 to 100 based on five key aspects: Financial Strength, Profitability, Growth, Valuation, and Momentum. Stocks with higher GF Score™ values have been found to generate higher long-term returns (backtested 2006-2021).
| Metric | Rating |
|---|---|
| GF Score™ | 96 |
| Financial Strength | 6/10 |
| Profitability | 10/10 |
| Growth | 10/10 |
| Valuation | 10/10 |
| Momentum | 6/10 |
Eli Lilly's strengths are evident in its high profitability and growth rankings, both rated at 10/10. This indicates that the company has consistently performed well in generating profits and expanding its business. However, its financial strength rating of 6/10 suggests that there may be some areas for improvement. For a deeper analysis, visit the LLY stock page.
What Are Insiders Doing with LLY Stock?
In the past three months, insider activity has shown a significant sell-off, with a total of $18.6 million in shares sold. This could indicate a lack of confidence among insiders regarding the stock's short-term performance, which investors should monitor closely.
What This Means for Investors
Overall, Eli Lilly appears to be a compelling investment opportunity given its strong GF Score™, undervalued status according to GF Value™, and solid growth prospects in the obesity treatment market. However, the recent insider selling may warrant caution. For the complete analysis, visit the LLY stock page. You can also use the GuruFocus Stock Screener to find similar opportunities.
Frequently Asked Questions
What is LLY's GF Score™?
LLY's GF Score™ is 96/100, indicating a strong overall performance based on various financial metrics.
Is LLY overvalued or undervalued?
LLY is currently undervalued by approximately 15.5%, with a GF Value™ of $1419.69 compared to its current price of $1200.06.
What is LLY's P/E ratio compared to historical?
LLY's current P/E (TTM) ratio is 42.63x, which is lower than its 5-year median P/E of 53.37x, suggesting potential undervaluation.
This stock alert was generated using automated technology and GuruFocus financial data to provide readers with timely and accurate market reporting. This content was reviewed by GuruFocus editorial team prior to publication. Please send any questions or comments about this story to [email protected].

