


On July 07, 2026, Trimble Inc. TRMB experienced a 2.9% rise following news of its plans to divest its transportation and logistics division. The company is reportedly collaborating with Goldman Sachs to facilitate the sale, as indicated by sources close to the situation.
- Trimble Inc. has a market capitalization of approximately $12.39 billion.
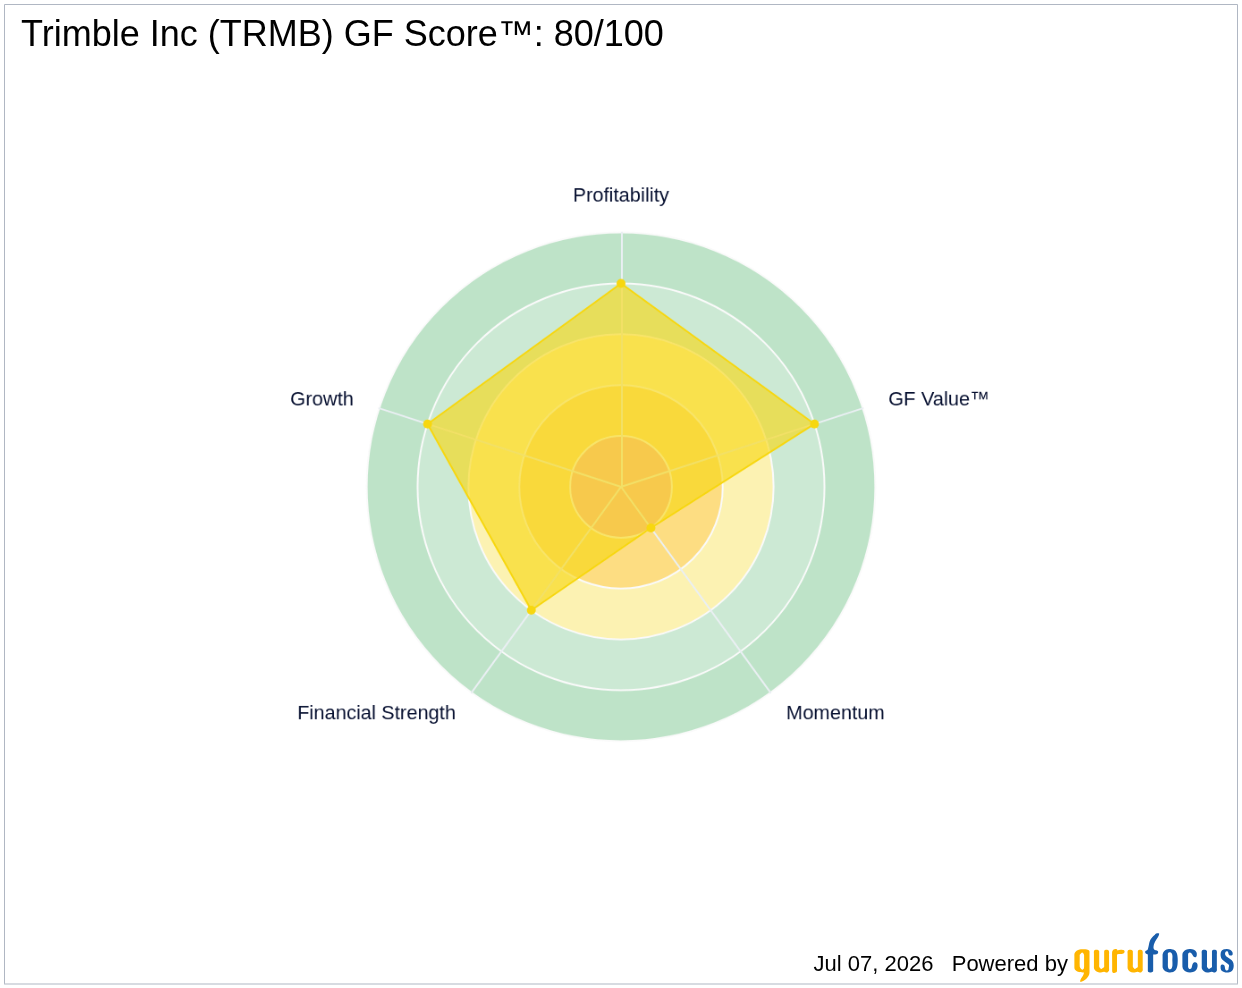
- GF Score™: 80/100, indicating a strong potential for long-term returns.
- Insider activity shows $1.6 million in shares sold over the past three months, with no purchases.
What's Behind the News?
The announcement of Trimble Inc.'s intent to divest its transportation and logistics division marks a significant strategic shift for the company. This move is expected to allow Trimble to focus on its core competencies in technology solutions that enhance productivity and sustainability in various sectors, particularly construction and agriculture. The collaboration with Goldman Sachs for the sale indicates a well-planned approach to maximizing value from this division, which may not align with the company’s long-term strategic goals.
Trimble Inc. operates within the technology sector, specifically in the hardware industry, providing location-based solutions and software for various applications. With a market cap of approximately $12.39 billion, Trimble serves a diverse clientele, including professionals in architecture, engineering, construction, and agriculture. The company’s commitment to innovation and efficiency positions it favorably in a rapidly evolving market.
How Is TRMB Valued?
Currently, GF Value™ data is not available for Trimble Inc. However, the company's P/E ratio stands at 27.98x, which is relatively close to its 5-year median P/E ratio. This suggests that the stock is trading at a valuation that reflects its earnings potential, although it may not be considered undervalued compared to historical averages. Investors should consider this P/E ratio in the context of the company's growth prospects and market conditions. For more detailed valuation insights, visit the TRMB stock page.
What Does TRMB's GF Score™ Tell Us?
The GF Score™ ranks stocks from 0 to 100 based on five key aspects: Financial Strength, Profitability, Growth, Valuation, and Momentum. Stocks with higher GF Score™ values have been found to generate higher long-term returns (backtested 2006-2021).
| Metric | Rating |
|---|---|
| GF Score™ | 80 |
| Financial Strength | 6/10 |
| Profitability | 8/10 |
| Growth | 8/10 |
Trimble Inc.'s GF Score™ of 80 indicates a strong position in the market, particularly in terms of profitability and growth, which are rated 8/10. However, the financial strength rating of 6/10 suggests that while the company is stable, there are areas for improvement, particularly in asset efficiency and return on invested capital. This mixed profile highlights both the potential and the challenges that investors may face. For further details, visit the TRMB stock page.
What Are Insiders Doing with TRMB Stock?
In the past three months, insider activity has shown a total of $1.6 million in shares sold, with no insider purchases reported. This trend may indicate a cautious outlook from insiders regarding the stock's future performance.
What This Means for Investors
Overall, Trimble Inc. presents a compelling case for potential investors, with a strong GF Score™ and solid profitability metrics. However, the insider selling activity and the company's financial strength rating suggest that investors should proceed with caution and conduct further research before making investment decisions. For the complete analysis, visit the TRMB stock page. You can also use the GuruFocus Stock Screener to find similar opportunities.
Frequently Asked Questions
What is TRMB's GF Score™?
TRMB's GF Score™ is 80/100, indicating a strong potential for long-term returns based on various financial metrics.
How is TRMB valued?
TRMB has a P/E ratio of 27.98x, which suggests that the stock is trading at a valuation reflective of its earnings potential, though it is not considered undervalued compared to historical averages.
What is TRMB's P/E ratio compared to historical?
TRMB's current P/E ratio of 27.98x is close to its historical averages, indicating that it is trading at a valuation consistent with its earnings potential, but not necessarily at a discount.
This stock alert was generated using automated technology and GuruFocus financial data to provide readers with timely and accurate market reporting. This content was reviewed by GuruFocus editorial team prior to publication. Please send any questions or comments about this story to [email protected].

