


On July 07, 2026, Microbot Medical Inc. MBOT announced a remarkable growth of over 100% in revenue and customer acquisitions in Q2 2026 compared to Q1, following the U.S. launch of its LIBERTY® Endovascular Robotic System. The company expanded its customer base across several states and entered an agreement with Lovell Government Services to provide the LIBERTY System to federal healthcare systems. Additionally, Microbot increased its U.S. sales territories from 4 to 8, with plans to reach 12 by year-end, and secured regulatory approval in Israel for the LIBERTY System.
- Market Cap: $127.28 million
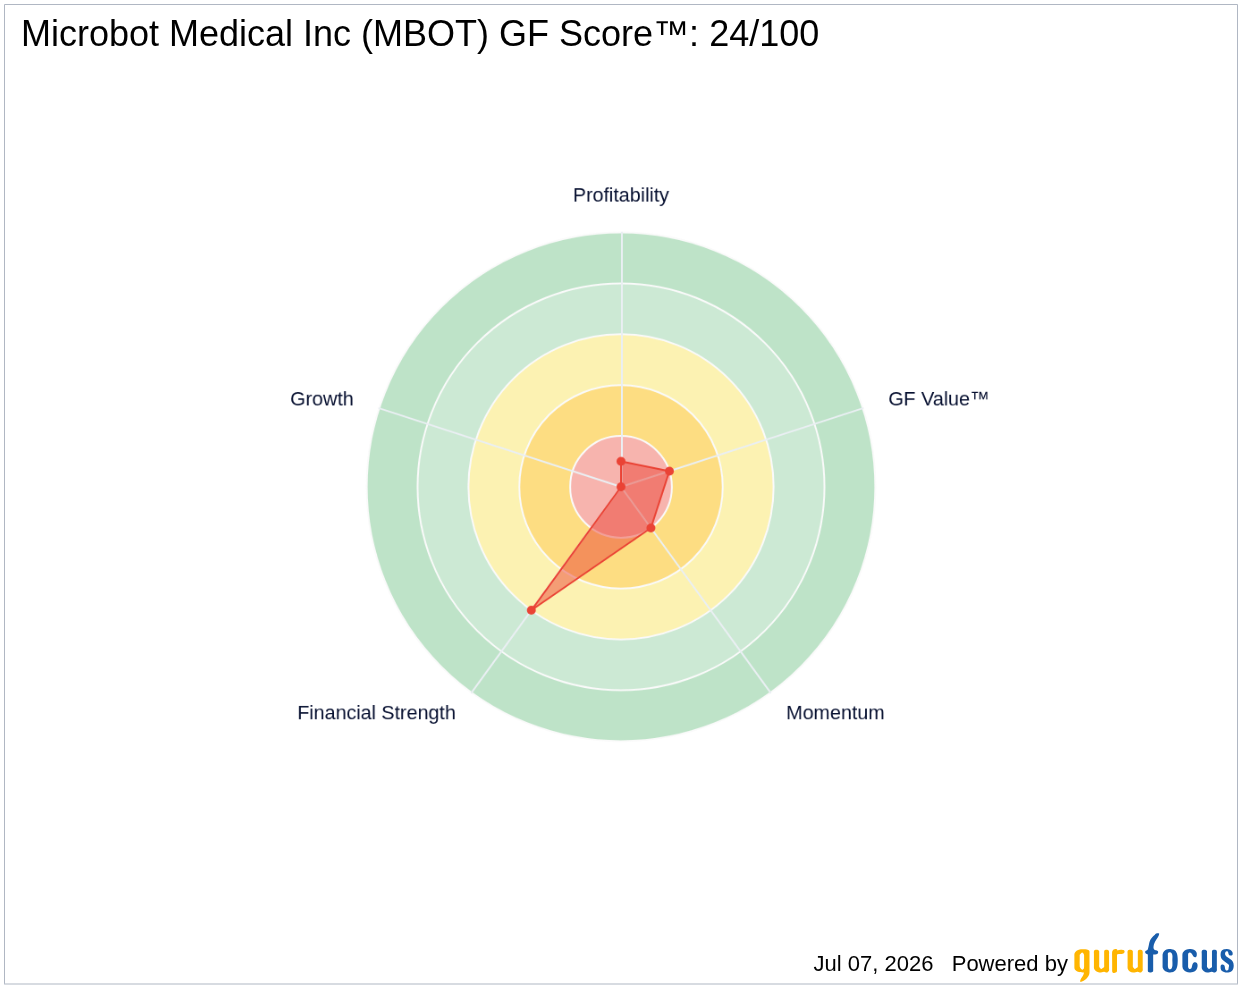
- GF Score™: 24/100, indicating potential challenges in financial health and profitability.
- Financial Strength: 6/10, suggesting a stable financial situation despite operational losses.
What's Behind the News?
The announcement of over 100% growth in revenue and customer acquisitions is a significant milestone for Microbot Medical, particularly as it follows the launch of its innovative LIBERTY® Endovascular Robotic System. This system is designed for minimally invasive surgical procedures, which is a growing market as healthcare providers seek to improve patient outcomes while reducing recovery times. The partnership with Lovell Government Services further expands Microbot's reach into federal healthcare systems, potentially increasing its revenue streams and customer base.
Microbot Medical Inc. operates within the healthcare sector, specifically in the Medical Devices & Instruments industry. With a market capitalization of $127.28 million, the company focuses on developing next-generation robotic devices aimed at enhancing surgical procedures. The LIBERTY platform represents a significant advancement in the field of robotic surgery, positioning Microbot as a key player in the medical device market.
How Is MBOT Valued?
Currently, GF Value™ data is not available for Microbot Medical. However, the company’s price-to-sales (P/S) ratio stands at an exceptionally high 950, indicating that the stock may be overvalued relative to its sales. This high P/S ratio suggests that investors are paying a premium for the stock, likely due to expectations of future growth driven by recent product launches and market expansion. For more detailed information, visit the MBOT stock page.
What Does MBOT's GF Score™ Tell Us?
The GF Score™ ranks stocks from 0 to 100 based on five key aspects: Financial Strength, Profitability, Growth, Valuation, and Momentum. Stocks with higher GF Score™ values have been found to generate higher long-term returns (backtested 2006-2021).
| Metric | Rating |
|---|---|
| GF Score™ | 24 |
| Financial Strength | 6/10 |
| Profitability | 1/10 |
Microbot Medical's GF Score™ of 24 indicates significant challenges, particularly in profitability, where it ranks just 1 out of 10. While the company has a decent financial strength rating of 6 out of 10, its operational losses and high P/S ratio raise concerns about its long-term sustainability. Investors should be cautious and consider these factors when evaluating the stock. For more details, visit the MBOT stock page.
What Are Insiders Doing with MBOT Stock?
There has been no insider buying or selling activity reported in the last 12 months, indicating a lack of insider confidence or activity in the stock at this time.
What This Means for Investors
Microbot Medical Inc. is experiencing significant growth following the launch of its LIBERTY® Endovascular Robotic System, but its low GF Score™ and high P/S ratio suggest potential risks for investors. While the company is expanding its market presence, the challenges in profitability and operational losses should be carefully considered.
For the complete analysis, visit the MBOT stock page. You can also use the GuruFocus Stock Screener to find similar opportunities.
Frequently Asked Questions
What is MBOT's GF Score™?
MBOT's GF Score™ is 24/100, indicating potential challenges in financial health and profitability.
How is MBOT valued?
MBOT has a very high price-to-sales (P/S) ratio of 950, suggesting that the stock may be overvalued relative to its sales.
What is MBOT's P/E ratio compared to historical?
MBOT does not have a P/E ratio available due to negative earnings, but its financial strength is rated at 6/10, indicating a stable financial situation despite operational losses.
This stock alert was generated using automated technology and GuruFocus financial data to provide readers with timely and accurate market reporting. This content was reviewed by GuruFocus editorial team prior to publication. Please send any questions or comments about this story to [email protected].

