


On July 13, 2026, Thermo Fisher Scientific Inc. TMO was highlighted in a recent valuation analysis. The company's intrinsic value, as derived from a Discounted Cash Flow (DCF) model, is approximately $478 per share, closely aligning with its current market price. Here are some key points to consider:
- GF Value™ verdict: Current Price $529.03 vs GF Value™ $585.59 = 9.7% undervalued
- GF Score™: 85/100, indicating strong overall performance
- Key financial signal: P/E (TTM) at 29.08x, compared to a 5-year median P/E of 31.32x
What's Behind the News?
The valuation analysis of Thermo Fisher Scientific Inc. TMO is significant as it reflects the company's robust financial performance and growth potential in the life sciences sector. The DCF model, which estimates a company's value based on projected future cash flows, indicates that TMO is currently trading below its intrinsic value. This suggests that investors may have an opportunity to acquire shares at a favorable price relative to their estimated worth.
Thermo Fisher Scientific operates in the healthcare sector, specifically within the Medical Diagnostics & Research industry. With a market capitalization of approximately $196.6 billion, the company is a leader in providing scientific instruments, laboratory equipment, diagnostics consumables, and life science reagents. For the fiscal year 2025, TMO is projected to generate $44.56 billion in revenue, reflecting a 4% year-over-year increase, alongside a GAAP diluted earnings per share of $17.74, which represents a 7% growth.
Is TMO Overvalued or Undervalued?
According to the GF Value™, Thermo Fisher Scientific is currently valued at $585.59, which positions the stock as 9.7% undervalued compared to its current trading price of $529.03. This margin of safety suggests that investors might find TMO shares appealing, as they are priced below their intrinsic value. The company's P/E (TTM) ratio stands at 29.08x, which is lower than its 5-year median P/E of 31.32x, indicating that the stock may be trading at a discount relative to its historical valuation.
For more detailed insights, you can visit the GF Value™ page.
What Does TMO's GF Score™ Tell Us?
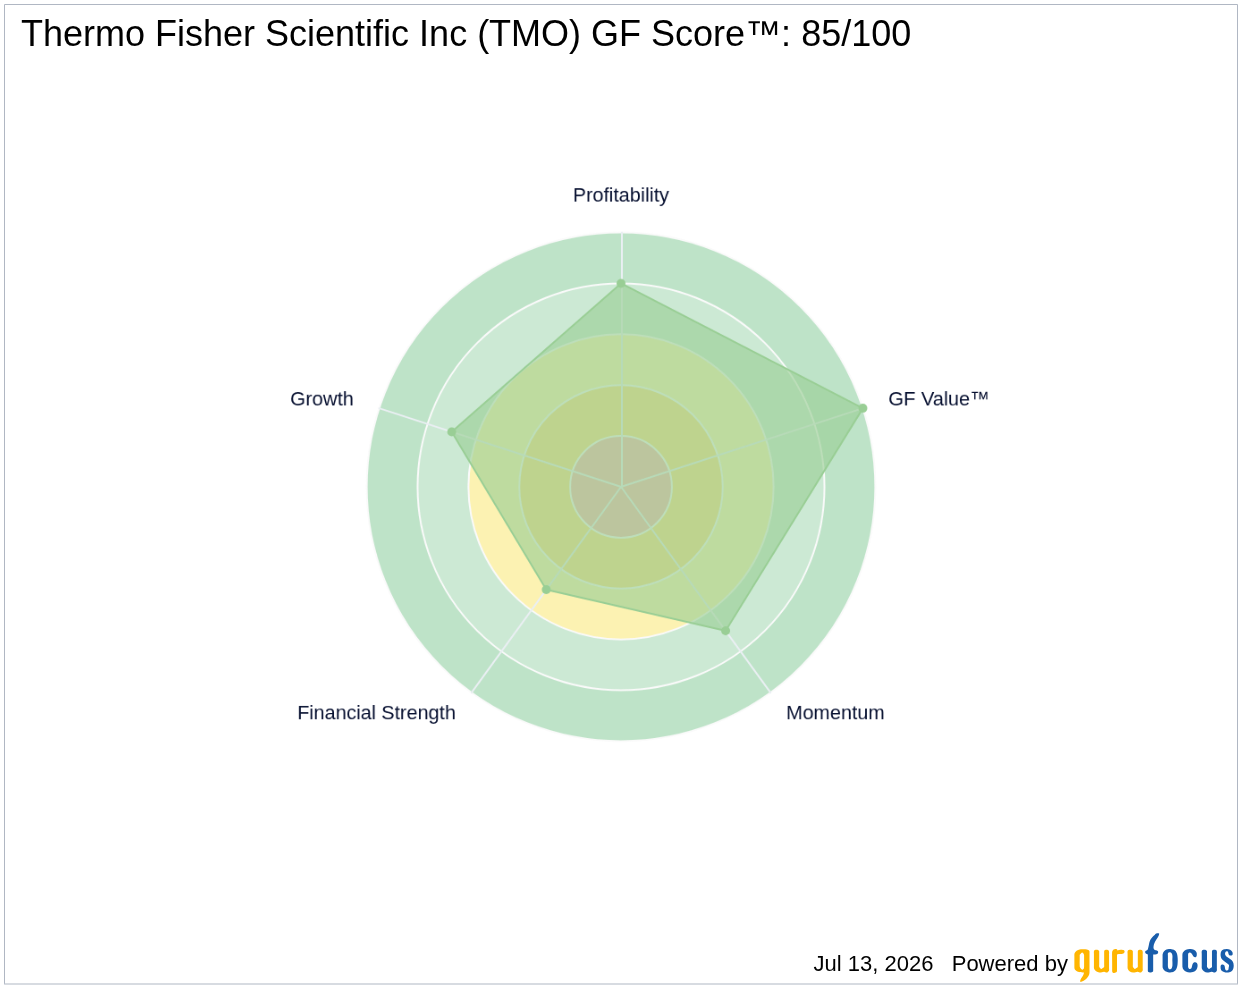
The GF Score™ for Thermo Fisher Scientific is 85 out of 100, reflecting its strong performance across several key metrics. The GF Score™ evaluates stocks based on Financial Strength, Profitability, Growth, Valuation, and Momentum, with higher scores indicating a greater potential for long-term returns.
| GF Score™ | 85 |
| Financial Strength | 5/10 |
| Profitability | 8/10 |
| Growth | 7/10 |
| Valuation | 10/10 |
| Momentum | 7/10 |
Thermo Fisher's strengths lie in its high profitability and valuation ranks, suggesting that the company is not only generating solid earnings but is also considered fairly valued compared to its peers. However, its financial strength rank of 5 indicates some caution regarding its balance sheet stability.
For further details on TMO, visit the TMO stock page.
What Are Insiders Doing with TMO Stock?
In terms of insider activity, there have been no reported purchases of TMO stock in the last three months, while insiders have sold shares worth approximately $185,064. This activity may indicate a cautious sentiment among insiders regarding the stock's near-term performance.
What This Means for Investors
The current analysis suggests that Thermo Fisher Scientific Inc. is modestly undervalued based on its GF Value™ and strong GF Score™. Investors may want to consider these factors when evaluating their positions in TMO. For the complete analysis, visit the TMO stock page. You can also use the GuruFocus Stock Screener to find similar opportunities.
Frequently Asked Questions
What is TMO's GF Score™?
TMO's GF Score™ is 85 out of 100, indicating strong overall performance and potential for long-term returns.
Is TMO overvalued or undervalued?
TMO is currently 9.7% undervalued, with a GF Value™ of $585.59 compared to its current price of $529.03.
What is TMO's P/E ratio compared to historical?
TMO's current P/E (TTM) is 29.08x, which is lower than its 5-year median P/E of 31.32x, suggesting it may be trading at a discount relative to its historical valuation.
This stock alert was generated using automated technology and GuruFocus financial data to provide readers with timely and accurate market reporting. This content was reviewed by GuruFocus editorial team prior to publication. Please send any questions or comments about this story to [email protected].

