


On July 14, 2026, Fastenal Co FAST reported impressive results for Q2 2026, highlighting a 14.7% increase in daily sales. The company also achieved significant operating margin expansion and a decade-high return on invested capital. Despite a slight adjustment in their full-year estimate, Fastenal remains confident in its strategic direction amid a leadership transition.
- Fastenal's current P/E ratio stands at 39.93x, indicating a premium valuation in the industrial distribution sector.
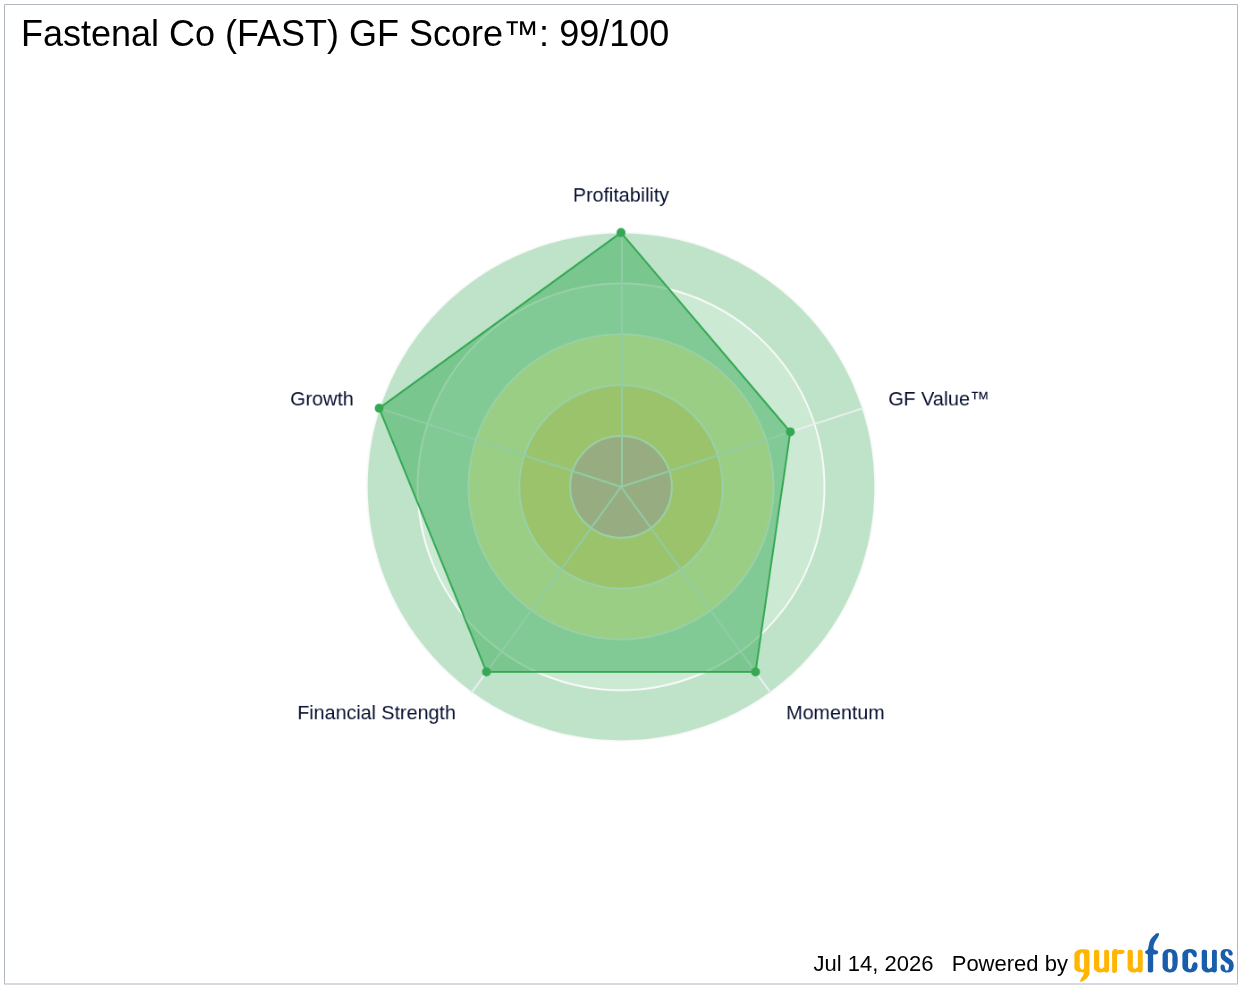
- GF Score™: 99/100, indicating exceptional performance across key financial metrics.
- Fastenal's financial strength is rated 9/10, reflecting a robust balance sheet and operational efficiency.
What's Behind the News?
Fastenal's Q2 2026 results are a testament to its strong operational performance and strategic initiatives. The reported 14.7% increase in daily sales demonstrates the company's ability to capture market demand effectively. The expansion of operating margins and a return on invested capital at a decade-high signifies that Fastenal is not only growing but doing so efficiently, enhancing shareholder value in the process. The slight adjustment in the full-year estimate to 63%-64% suggests a cautious outlook, but the leadership transition does not seem to hinder the company's confidence in its strategic direction.
Fastenal operates in the industrial distribution sector, specializing in the supply of maintenance, repair, and operations (MRO) products. With a market capitalization of approximately $52.26 billion, Fastenal has established itself as a leader in the industry, expanding its product offerings from basic fasteners to a wide array of tools, safety equipment, and janitorial supplies. The company's unique business model includes installing vending machines and personnel on-site for larger customers, which enhances customer loyalty and operational efficiency.
How Is FAST Valued?
Currently, GF Value™ data is not available for Fastenal. However, the company's P/E ratio of 39.93x suggests that the stock is trading at a premium compared to historical averages. This valuation reflects investor confidence in Fastenal's growth prospects and operational efficiency. For more detailed insights, visit the FAST stock page.
What Does FAST's GF Score™ Tell Us?
The GF Score™ ranks stocks from 0 to 100 based on five key aspects: Financial Strength, Profitability, Growth, Valuation, and Momentum. Stocks with higher GF Score™ values have been found to generate higher long-term returns (backtested 2006-2021).
| Metric | Rating |
|---|---|
| GF Score™ | 99 |
| Financial Strength | 9/10 |
| Profitability | 10/10 |
| Growth | 10/10 |
Fastenal's strengths are evident in its high GF Score™ of 99, reflecting exceptional financial strength and profitability. The company’s financial metrics indicate strong operational efficiency and growth potential, making it a standout in the industrial distribution sector. However, the premium valuation may warrant caution for potential investors. For more information, visit the FAST stock page.
What Are Insiders Doing with FAST Stock?
In the past 12 months, there have been 6 insider buys and 9 insider sells, with a total insider sell value of approximately $17.55 million. This activity indicates a mix of confidence and caution among insiders regarding the company's future performance.
What This Means for Investors
Fastenal's strong financial metrics, reflected in its high GF Score™ and robust profitability rankings, suggest that the company is well-positioned for continued growth. However, the high P/E ratio and insider selling activity may raise questions about the stock's current valuation. Investors should consider these factors when evaluating Fastenal's stock. For the complete analysis, visit the FAST stock page. You can also use the GuruFocus Stock Screener to find similar opportunities.
Frequently Asked Questions
What is FAST's GF Score™?
FAST's GF Score™ is 99/100, indicating exceptional performance across key financial metrics and a strong potential for long-term returns.
How is FAST valued?
FAST's current P/E ratio is 39.93x, suggesting a premium valuation compared to historical averages, reflecting investor confidence in its growth prospects.
What is FAST's P/E ratio compared to historical?
FAST's P/E ratio of 39.93x indicates a higher valuation compared to its historical averages, which may suggest that the stock is trading at a premium in the current market environment.
This stock alert was generated using automated technology and GuruFocus financial data to provide readers with timely and accurate market reporting. This content was reviewed by GuruFocus editorial team prior to publication. Please send any questions or comments about this story to [email protected].

