

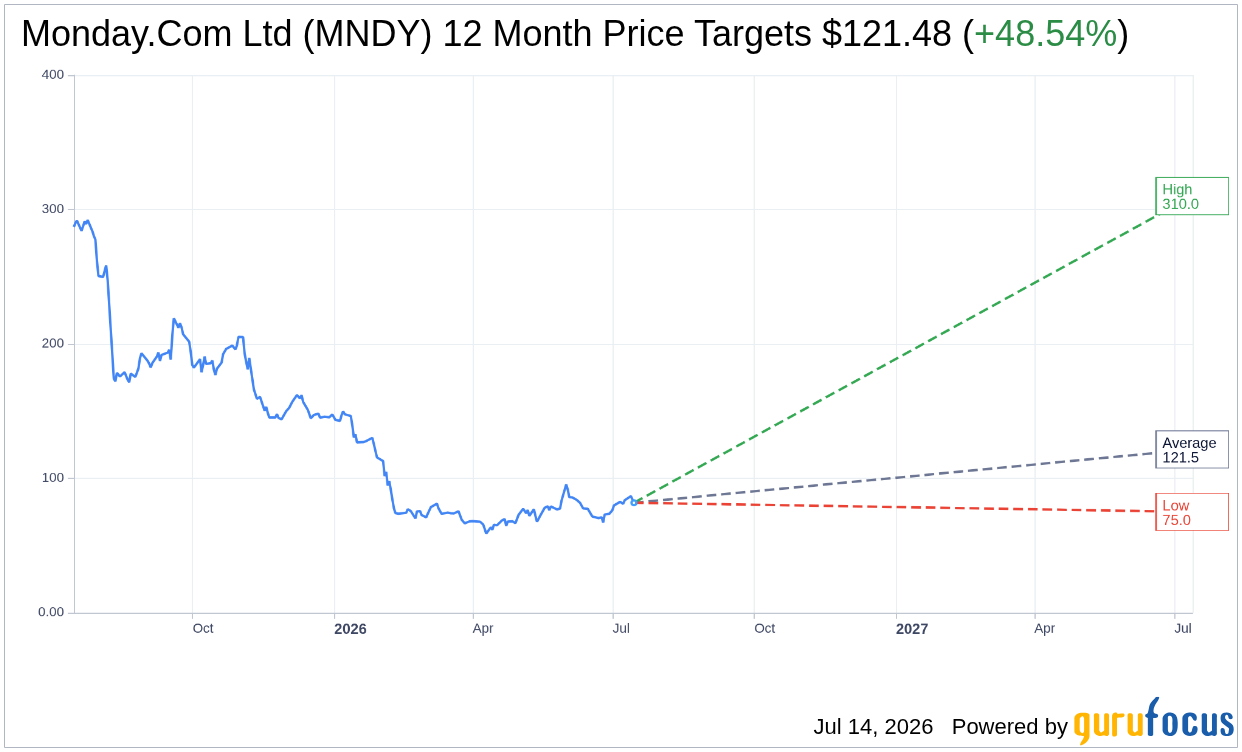
On July 14, 2026, Monday.Com Ltd MNDY shares fell 5.7% today, bringing the current price to $81.78. This decline comes amid a challenging year for the stock, which has seen a 52-week range from $57.50 to $296.94. The year-to-date performance is particularly stark, reflecting a 44.5% decline.
- GF Value™ verdict: Current price of $81.78 is 77.7% below the GF Value™ estimate of $366.07.
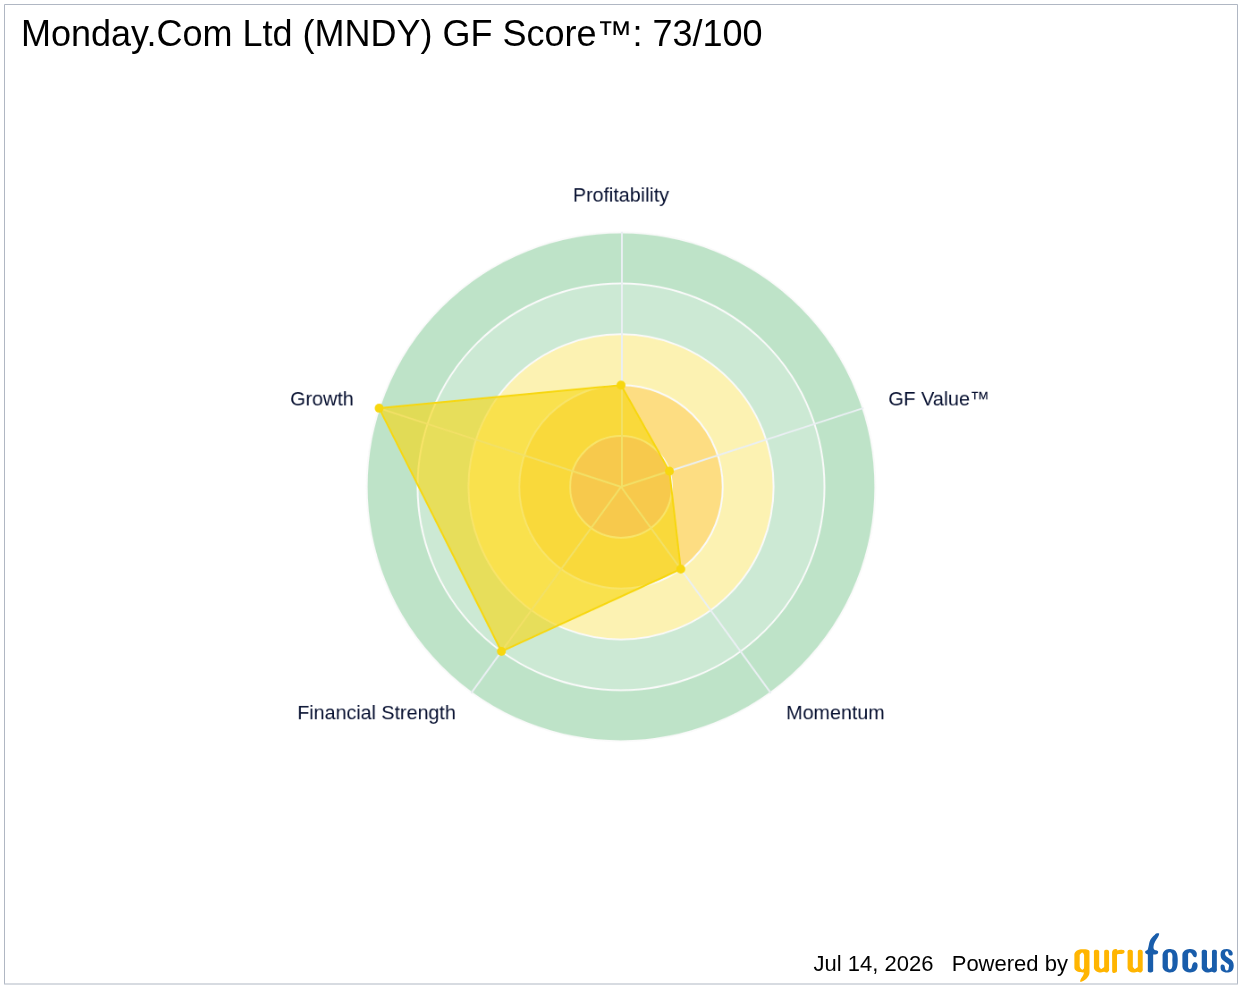
- GF Score™ of 73/100 indicates an above-average potential for generating long-term returns.
- Most notable signal: Insiders sold $0.2 million worth of shares in the last three months, with no buying activity.
Is MNDY Overvalued or Undervalued?
According to GF Value™, Monday.Com Ltd is currently undervalued, with a significant margin of safety of 77.7%. The current price of $81.78 stands in stark contrast to the GF Value™ estimate of $366.07, suggesting that the stock may present a compelling opportunity for value-oriented investors. However, the GF Valuation label indicates a "Possible Value Trap," advising caution as the stock could remain depressed for an extended period. GF Value™ is GuruFocus' proprietary measure of intrinsic value, calculated from historical trading multiples, past business growth, and future performance estimates.
While the undervaluation signals potential upside, investors should be wary of the risk associated with this label. The absence of insider buying and the significant decline in stock price over the past year raise concerns about the company's short-term performance and market sentiment. As such, while there appears to be an opportunity based on valuation alone, the broader context must be carefully considered.

How Does MNDY's Valuation Compare to Its History?
| Metric | Current | Historical |
|---|---|---|
| P/E (TTM) | 35.6x | 292.0x |
| Forward P/E | 18.4x | N/A |
The current P/E (TTM) of 35.6x is markedly below the 5-year median P/E of 292.0x, indicating that the stock is trading at a significantly lower valuation than its historical average. This aligns with the GF Value™ assessment of undervaluation, suggesting that the market may not be fully recognizing the company's potential. The forward P/E of 18.4x also suggests that there may be expectations for recovery in earnings, although caution is warranted given the recent price performance.
What Does MNDY's GF Score™ Tell Us?
| Metric | Rating |
|---|---|
| GF Score™ | 73 |
| Financial Strength | 8/10 |
| Profitability | 4/10 |
| Growth | 10/10 |
| Valuation | 2/10 |
| Momentum | 4/10 |
The GF Score™ of 73/100 indicates that Monday.Com Ltd is positioned above average in terms of long-term return potential based on key financial metrics. The strongest area is its Growth rank of 10/10, suggesting robust growth prospects. However, the weakest aspect is the Valuation rank of 2/10, which aligns with the current undervaluation concerns highlighted by the GF Value™. The Financial Strength score of 8/10 indicates a solid balance sheet, which may provide some stability despite the current market challenges.
What Are Insiders Doing with MNDY Stock?
In recent months, insider activity has shown a trend of selling, with insiders offloading $0.2 million worth of shares and no recorded purchases. This pattern may indicate a lack of confidence among insiders regarding the company's short-term prospects. Typically, insider buying can be seen as a positive signal, suggesting that those closest to the company believe in its future potential. Conversely, the absence of buying coupled with recent sales can raise concerns among investors regarding management's outlook.
What This Means for Investors
Based on the GF Value™ assessment, Monday.Com Ltd MNDY appears to be undervalued, with a significant margin of safety. However, potential investors should proceed with caution due to the company's recent performance, insider selling activity, and the "Possible Value Trap" designation. Understanding the broader context and future performance expectations will be crucial for making informed decisions.
For the complete analysis, visit the Monday.Com Ltd MNDY stock page. You can also explore the GF Value™ page for detailed valuation methodology, or use the GuruFocus Stock Screener to find similar opportunities.
Frequently Asked Questions
What is MNDY's GF Score™?
MNDY's GF Score™ is 73/100, indicating an above-average potential for generating long-term returns based on key financial metrics.
Is MNDY overvalued or undervalued?
MNDY is currently undervalued, with a GF Value™ of $366.07, suggesting a significant upside from the current price of $81.78.
What is MNDY's P/E ratio?
MNDY's P/E (TTM) is 35.6x, which is significantly below its 5-year median of 292.0x, indicating that the stock is trading at a much lower valuation than its historical average.
This stock alert was generated using automated technology and GuruFocus financial data to provide readers with timely and accurate market reporting. This content was reviewed by GuruFocus editorial team prior to publication. Please send any questions or comments about this story to [email protected].

