


On July 16, 2026, Belden Inc. BDC, a leading global provider of professional networking solutions, is set to announce its second-quarter financial results for the period ending June 28, 2026, before the U.S. market opens on July 30. The company's management will hold a conference call at 8:30 AM Eastern Time on the same day to discuss the performance.
- GF Value™ verdict: Current Price $100.04 vs GF Value™ $127.37 = 21.5% undervalued
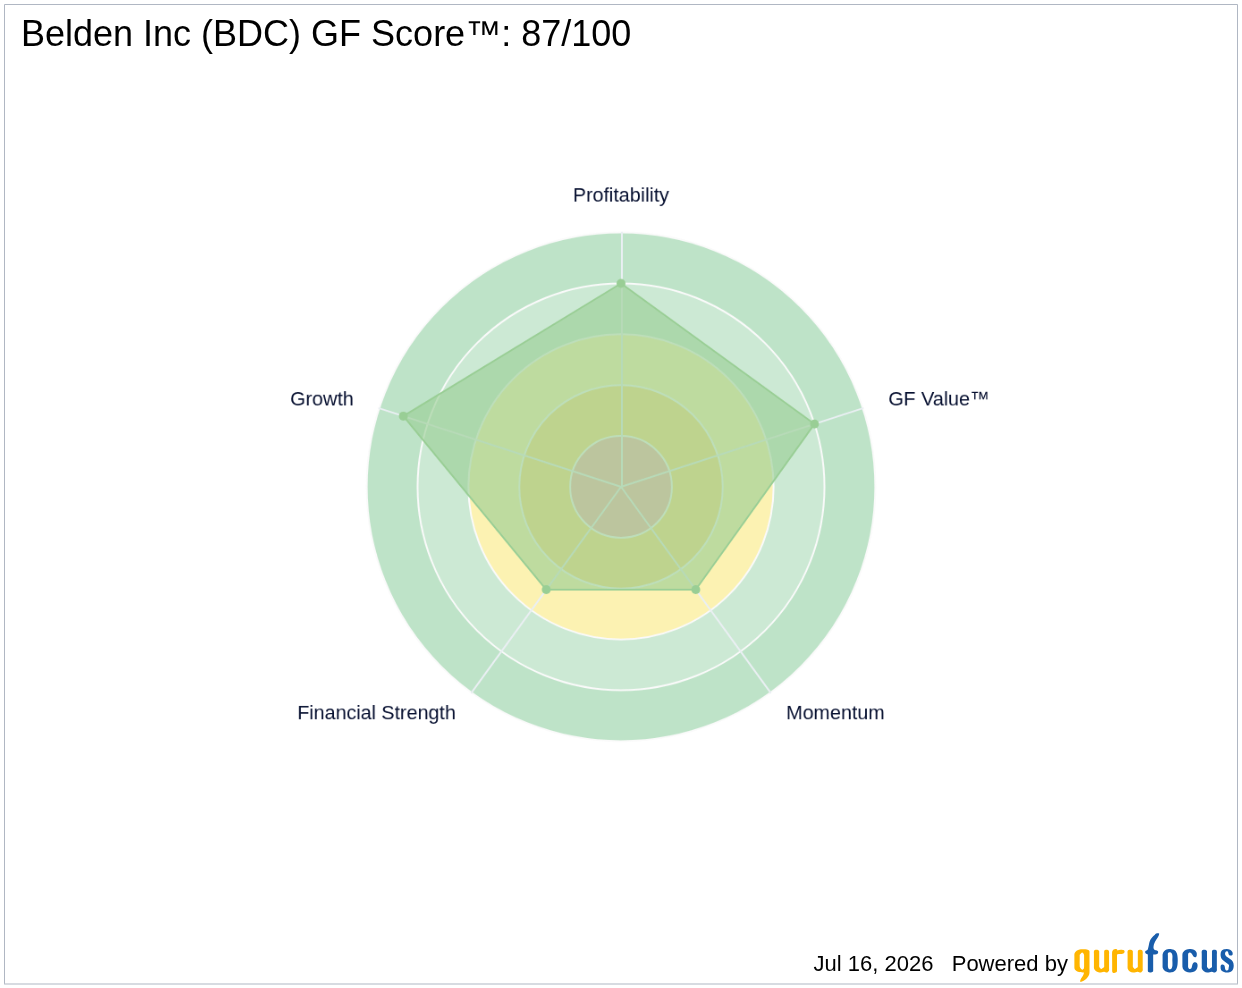
- GF Score™: 87/100, indicating strong overall performance
- Insider activity: $6.0 million in insider purchases over the last 3 months
What's Behind the News?
Belden Inc. is poised to release its second-quarter earnings, which are highly anticipated given the company's strong performance in the previous quarter. In the first quarter, Belden reported a revenue of $696 million, representing an 11% year-over-year increase, along with adjusted earnings per share of $1.77, surpassing market expectations. The guidance for the second quarter suggests revenue between $735 million and $750 million, with adjusted earnings per share expected to range from $1.95 to $2.05. This positive outlook reflects the company's robust market position and operational efficiency.
Founded in 1902 and headquartered in St. Louis, Missouri, Belden operates primarily in the technology sector, specifically within the hardware industry. With a market capitalization of approximately $3.9 billion, Belden is one of the largest manufacturers of professional electronic cables worldwide. The company serves various markets, including industrial automation, data centers, broadcasting, and smart buildings, through its two main segments: enterprise solutions and industrial automation solutions.
Is BDC Overvalued or Undervalued?
According to GuruFocus, Belden Inc. has a GF Value™ of $127.37, which indicates that the stock is currently undervalued by approximately 21.5% given its current price of $100.04. This margin of safety suggests that investors may have an opportunity to purchase the stock at a discount relative to its intrinsic value. The company's P/E (TTM) stands at 16.84x, significantly lower than its 5-year median P/E of 21.14x, further supporting the notion that the stock is undervalued. For more details, visit GF Value™.
What Does BDC's GF Score™ Tell Us?
The GF Score™ ranks stocks from 0 to 100 based on five key aspects: Financial Strength, Profitability, Growth, Valuation, and Momentum. Stocks with higher GF Score™ values have been found to generate higher long-term returns (backtested 2006-2021).
| GF Score™ | 87 |
| Financial Strength | 5/10 |
| Profitability | 8/10 |
| Growth | 9/10 |
| Valuation | 8/10 |
| Momentum | 5/10 |
Belden's strengths lie in its high profitability and growth ranks, which are 8 and 9 out of 10, respectively. However, its financial strength rank of 5 indicates that there may be some areas for improvement. Overall, the strong GF Score™ suggests that Belden is well-positioned for long-term success. For more information, visit the BDC stock page.
What Are Insiders Doing with BDC Stock?
In the past three months, insiders have shown confidence in Belden's future by purchasing $6.0 million worth of stock, while there have been no recorded sales. This insider buying can be a positive signal regarding the company's prospects.
What This Means for Investors
Given the current undervaluation of Belden Inc. as indicated by its GF Value™ and the strong performance metrics reflected in its GF Score™, investors may find the stock appealing. The combination of solid financial results, positive insider activity, and a favorable valuation suggests that Belden is a company to watch in the upcoming earnings announcement. For the complete analysis, visit the BDC stock page. You can also use the GuruFocus Stock Screener to find similar opportunities.
Frequently Asked Questions
What is BDC's GF Score™?
BDC's GF Score™ is 87, indicating a strong overall performance based on various financial metrics.
Is BDC overvalued or undervalued?
BDC is currently undervalued, with a GF Value™ of $127.37 compared to its current price of $100.04, representing a 21.5% discount.
What is BDC's P/E ratio compared to historical?
BDC's P/E (TTM) is 16.84x, which is significantly lower than its 5-year median P/E of 21.14x, indicating potential undervaluation.
This stock alert was generated using automated technology and GuruFocus financial data to provide readers with timely and accurate market reporting. This content was reviewed by GuruFocus editorial team prior to publication. Please send any questions or comments about this story to [email protected].

